29
/
en
AIzaSyAYiBZKx7MnpbEhh9jyipgxe19OcubqV5w
April 1, 2024
25734
Central Europe and the Baltics
CEB
false
2
1
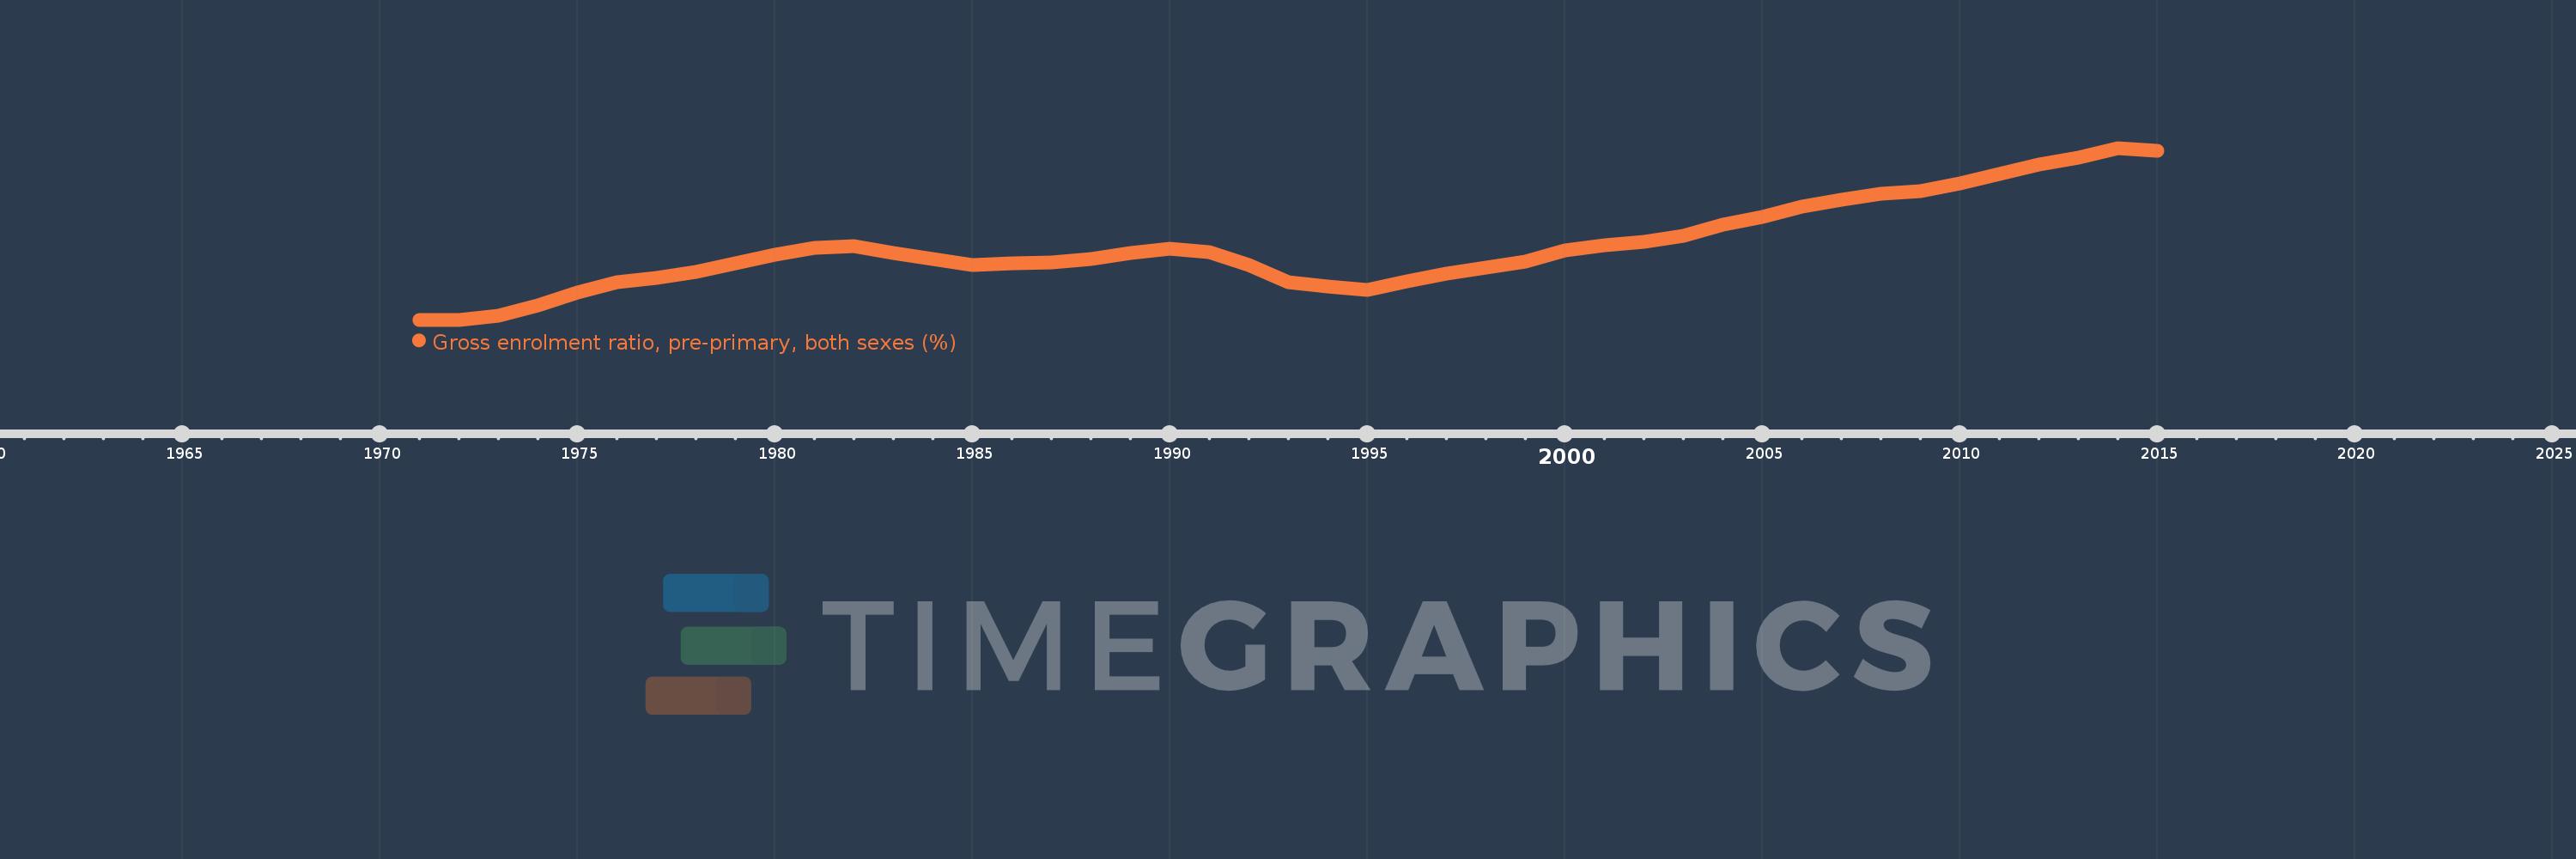
Gross enrolment ratio, pre-primary, both sexes (%)
2015,2014,2013,2012,2011,2010,2009,2008,2007,2006,2005,2004,2003,2002,2001,2000,1999,1998,1997,1996,1995,1994,1993,1992,1991,1990,1989,1988,1987,1986,1985,1984,1983,1982,1981,1980,1979,1978,1977,1976,1975,1974,1973,1972,1971
This statistics in other country:
AfghanistanAlbaniaAlgeriaAndorraAngolaAntigua and BarbudaArab WorldArgentinaArmeniaArubaAustraliaAustriaAzerbaijanBahamas, TheBahrainBangladeshBarbadosBelarusBelgiumBelizeBeninBermudaBhutanBoliviaBosnia and HerzegovinaBotswanaBrazilBritish Virgin IslandsBrunei DarussalamBulgariaBurkina FasoBurundiCabo VerdeCambodiaCameroonCanadaCaribbean small statesCentral African RepublicCentral Europe and the BalticsChadChileChinaColombiaComorosCongo, Dem. Rep.Congo, Rep.Costa RicaCote d'IvoireCroatiaCubaCyprusCzech RepublicDenmarkDjiboutiDominicaDominican RepublicEarly-demographic dividendEast Asia & PacificEast Asia & Pacific (excluding high income)East Asia & Pacific (IDA & IBRD countries)EcuadorEgypt, Arab Rep.El SalvadorEquatorial GuineaEritreaEstoniaEthiopiaEuro areaEurope & Central AsiaEurope & Central Asia (excluding high income)Europe & Central Asia (IDA & IBRD countries)European UnionFijiFinlandFragile and conflict affected situationsFranceGabonGambia, TheGeorgiaGermanyGhanaGreeceGrenadaGuatemalaGuineaGuinea-BissauGuyanaHaitiHeavily indebted poor countries (HIPC)High incomeHondurasHong Kong SAR, ChinaHungaryIBRD onlyIcelandIDA & IBRD totalIDA blendIDA onlyIDA totalIndiaIndonesiaIran, Islamic Rep.IraqIrelandIsraelItalyJamaicaJapanJordanKazakhstanKenyaKiribatiKorea, Dem. People’s Rep.Korea, Rep.KuwaitKyrgyz RepublicLao PDRLate-demographic dividendLatin America & Caribbean Latin America & Caribbean (excluding high income)Latin America & the Caribbean (IDA & IBRD countries)LatviaLeast developed countries: UN classificationLebanonLesothoLiberiaLibyaLiechtensteinLithuaniaLow & middle incomeLow incomeLower middle incomeLuxembourgMacao SAR, ChinaMacedonia, FYRMadagascarMalaysiaMaldivesMaliMaltaMarshall IslandsMauritaniaMauritiusMexicoMicronesia, Fed. Sts.Middle East & North AfricaMiddle East & North Africa (excluding high income)Middle East & North Africa (IDA & IBRD countries)Middle incomeMoldovaMongoliaMontenegroMoroccoMozambiqueMyanmarNamibiaNauruNepalNetherlandsNew ZealandNicaraguaNigerNigeriaNorth AmericaNorwayOECD membersOmanOther small statesPacific island small statesPakistanPalauPanamaPapua New GuineaParaguayPeruPhilippinesPolandPortugalPost-demographic dividendPre-demographic dividendPuerto RicoQatarRomaniaRussian FederationRwandaSamoaSan MarinoSao Tome and PrincipeSaudi ArabiaSenegalSerbiaSeychellesSierra LeoneSlovak RepublicSloveniaSmall statesSolomon IslandsSomaliaSouth AfricaSouth AsiaSouth Asia (IDA & IBRD)South SudanSpainSri LankaSt. Kitts and NevisSt. LuciaSt. Vincent and the GrenadinesSub-Saharan Africa Sub-Saharan Africa (excluding high income)Sub-Saharan Africa (IDA & IBRD countries)SudanSurinameSwazilandSwedenSwitzerlandSyrian Arab RepublicTajikistanTanzaniaThailandTimor-LesteTogoTongaTrinidad and TobagoTunisiaTurkeyTurkmenistanTuvaluUgandaUkraineUnited Arab EmiratesUnited KingdomUnited StatesUpper middle incomeUruguayUzbekistanVanuatuVenezuela, RBVietnamWest Bank and GazaWorldYemen, Rep.ZambiaZimbabwe Timeline:
This timeline shows a graph from 1971 to 2015 of Central Europe and the Baltics. No data until 1970. Number of actual observations by date: 45.
Source name:
World Development Indicators
Source organization:
UNESCO Institute for Statistics
Categories, topics:
Education
Last updated:
apr 23, 2017
Indicators value changes by year
Minimum:
45.219
jan 1, 1971
Maximum:
84.488
jan 1, 2014
At the date of observation
Value
Absolute change
Change from previous value
jan 1, 1971
45.219
+45.219
0.0%
jan 1, 1972
45.25
+0.031
0.07%
jan 1, 1973
46.113
+0.863
1.91%
jan 1, 1974
48.561
+2.448
5.31%
jan 1, 1975
51.519
+2.958
6.09%
jan 1, 1976
53.856
+2.337
4.54%
jan 1, 1977
54.76
+0.904
1.68%
jan 1, 1978
56.225
+1.466
2.68%
jan 1, 1979
58.111
+1.886
3.35%
jan 1, 1980
60.007
+1.895
3.26%
jan 1, 1981
61.626
+1.62
2.7%
jan 1, 1982
62.139
+0.513
0.83%
jan 1, 1983
60.564
-1.575
-2.54%
jan 1, 1984
59.151
-1.413
-2.33%
jan 1, 1985
57.681
-1.47
-2.48%
jan 1, 1986
58.033
+0.352
0.61%
jan 1, 1987
58.412
+0.379
0.65%
jan 1, 1988
59.144
+0.733
1.25%
jan 1, 1989
60.404
+1.259
2.13%
jan 1, 1990
61.534
+1.13
1.87%
jan 1, 1991
60.624
-0.91
-1.48%
jan 1, 1992
57.656
-2.967
-4.89%
jan 1, 1993
53.868
-3.788
-6.57%
jan 1, 1994
52.821
-1.047
-1.94%
jan 1, 1995
52.01
-0.811
-1.53%
jan 1, 1996
54.057
+2.047
3.94%
jan 1, 1997
55.678
+1.62
3.0%
jan 1, 1998
57.053
+1.375
2.47%
jan 1, 1999
58.531
+1.478
2.59%
jan 1, 2000
61.148
+2.617
4.47%
jan 1, 2001
62.311
+1.163
1.9%
jan 1, 2002
63.093
+0.783
1.26%
jan 1, 2003
64.439
+1.345
2.13%
jan 1, 2004
66.858
+2.419
3.75%
jan 1, 2005
68.641
+1.783
2.67%
jan 1, 2006
71.103
+2.462
3.59%
jan 1, 2007
72.551
+1.448
2.04%
jan 1, 2008
74.023
+1.472
2.03%
jan 1, 2009
74.705
+0.682
0.92%
jan 1, 2010
76.353
+1.648
2.21%
jan 1, 2011
78.612
+2.259
2.96%
jan 1, 2012
80.653
+2.041
2.6%
jan 1, 2013
82.349
+1.695
2.1%
jan 1, 2014
84.488
+2.139
2.6%
jan 1, 2015
83.872
-0.616
-0.73%
Ranking of countries by current statistics by years


Comments: