29
/
en
AIzaSyAYiBZKx7MnpbEhh9jyipgxe19OcubqV5w
April 1, 2024
94918
Burkina Faso
BFA
true
2
1
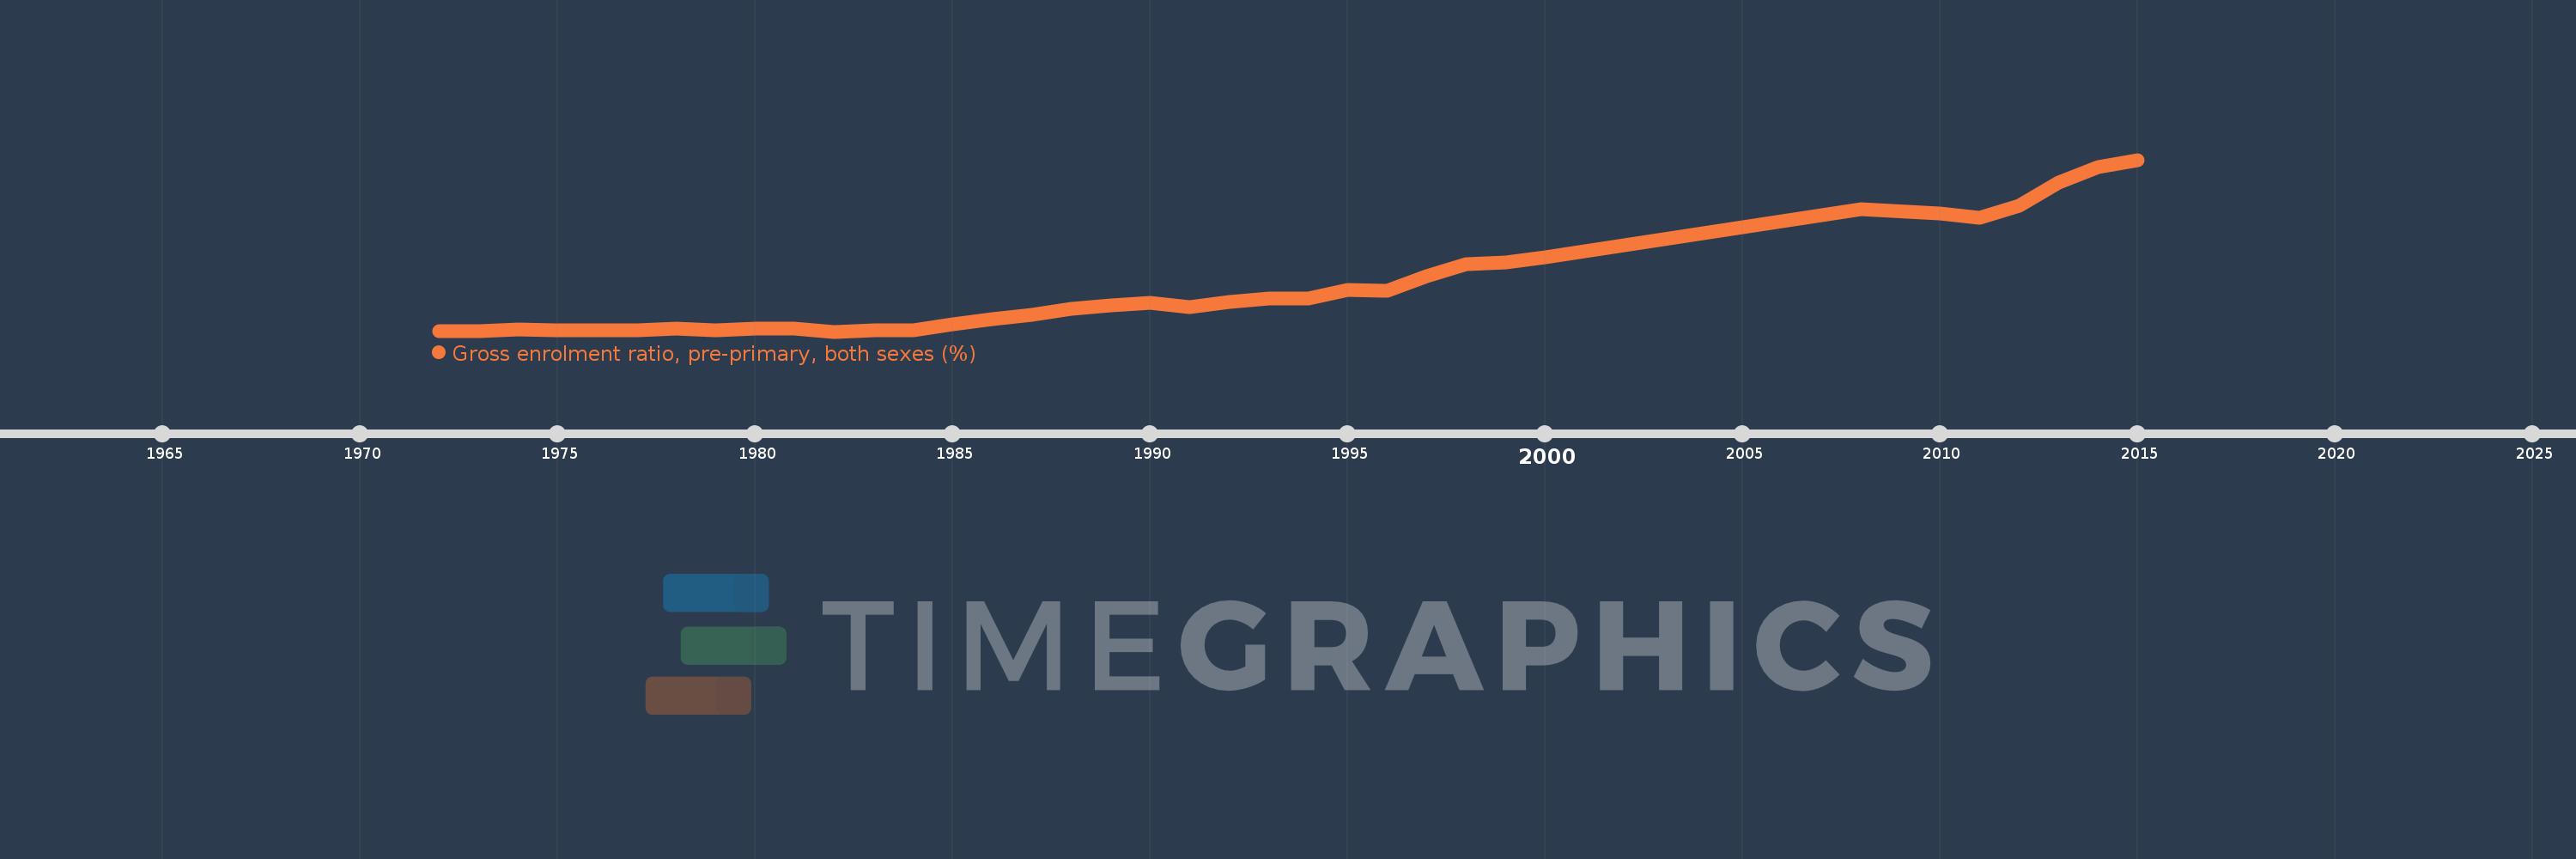
Gross enrolment ratio, pre-primary, both sexes (%)
2015,2014,2013,2012,2011,2010,2008,2000,1999,1998,1997,1996,1995,1994,1993,1992,1991,1990,1989,1988,1987,1986,1985,1984,1983,1982,1981,1980,1979,1978,1977,1976,1975,1974,1973,1972
This statistics in other country:
AfghanistanAlbaniaAlgeriaAndorraAngolaAntigua and BarbudaArab WorldArgentinaArmeniaArubaAustraliaAustriaAzerbaijanBahamas, TheBahrainBangladeshBarbadosBelarusBelgiumBelizeBeninBermudaBhutanBoliviaBosnia and HerzegovinaBotswanaBrazilBritish Virgin IslandsBrunei DarussalamBulgariaBurkina FasoBurundiCabo VerdeCambodiaCameroonCanadaCaribbean small statesCentral African RepublicCentral Europe and the BalticsChadChileChinaColombiaComorosCongo, Dem. Rep.Congo, Rep.Costa RicaCote d'IvoireCroatiaCubaCyprusCzech RepublicDenmarkDjiboutiDominicaDominican RepublicEarly-demographic dividendEast Asia & PacificEast Asia & Pacific (excluding high income)East Asia & Pacific (IDA & IBRD countries)EcuadorEgypt, Arab Rep.El SalvadorEquatorial GuineaEritreaEstoniaEthiopiaEuro areaEurope & Central AsiaEurope & Central Asia (excluding high income)Europe & Central Asia (IDA & IBRD countries)European UnionFijiFinlandFragile and conflict affected situationsFranceGabonGambia, TheGeorgiaGermanyGhanaGreeceGrenadaGuatemalaGuineaGuinea-BissauGuyanaHaitiHeavily indebted poor countries (HIPC)High incomeHondurasHong Kong SAR, ChinaHungaryIBRD onlyIcelandIDA & IBRD totalIDA blendIDA onlyIDA totalIndiaIndonesiaIran, Islamic Rep.IraqIrelandIsraelItalyJamaicaJapanJordanKazakhstanKenyaKiribatiKorea, Dem. People’s Rep.Korea, Rep.KuwaitKyrgyz RepublicLao PDRLate-demographic dividendLatin America & Caribbean Latin America & Caribbean (excluding high income)Latin America & the Caribbean (IDA & IBRD countries)LatviaLeast developed countries: UN classificationLebanonLesothoLiberiaLibyaLiechtensteinLithuaniaLow & middle incomeLow incomeLower middle incomeLuxembourgMacao SAR, ChinaMacedonia, FYRMadagascarMalaysiaMaldivesMaliMaltaMarshall IslandsMauritaniaMauritiusMexicoMicronesia, Fed. Sts.Middle East & North AfricaMiddle East & North Africa (excluding high income)Middle East & North Africa (IDA & IBRD countries)Middle incomeMoldovaMongoliaMontenegroMoroccoMozambiqueMyanmarNamibiaNauruNepalNetherlandsNew ZealandNicaraguaNigerNigeriaNorth AmericaNorwayOECD membersOmanOther small statesPacific island small statesPakistanPalauPanamaPapua New GuineaParaguayPeruPhilippinesPolandPortugalPost-demographic dividendPre-demographic dividendPuerto RicoQatarRomaniaRussian FederationRwandaSamoaSan MarinoSao Tome and PrincipeSaudi ArabiaSenegalSerbiaSeychellesSierra LeoneSlovak RepublicSloveniaSmall statesSolomon IslandsSomaliaSouth AfricaSouth AsiaSouth Asia (IDA & IBRD)South SudanSpainSri LankaSt. Kitts and NevisSt. LuciaSt. Vincent and the GrenadinesSub-Saharan Africa Sub-Saharan Africa (excluding high income)Sub-Saharan Africa (IDA & IBRD countries)SudanSurinameSwazilandSwedenSwitzerlandSyrian Arab RepublicTajikistanTanzaniaThailandTimor-LesteTogoTongaTrinidad and TobagoTunisiaTurkeyTurkmenistanTuvaluUgandaUkraineUnited Arab EmiratesUnited KingdomUnited StatesUpper middle incomeUruguayUzbekistanVanuatuVenezuela, RBVietnamWest Bank and GazaWorldYemen, Rep.ZambiaZimbabwe Timeline:
This timeline shows a graph from 1972 to 2015 of Burkina Faso. No data until 1971. Number of actual observations by date: 36.
Source name:
World Development Indicators
Source organization:
UNESCO Institute for Statistics
Categories, topics:
Education
Last updated:
apr 23, 2017
Indicators value changes by year
At the date of observation
Value
Absolute change
Change from previous value
jan 1, 1972
0.071
+0.071
0.0%
jan 1, 1973
0.08
+0.01
13.65%
jan 1, 1974
0.109
+0.029
35.56%
jan 1, 1975
0.098
-0.011
-10.01%
jan 1, 1976
0.085
-0.013
-12.85%
jan 1, 1977
0.088
+0.002
2.6%
jan 1, 1978
0.125
+0.037
42.49%
jan 1, 1979
0.097
-0.028
-22.49%
jan 1, 1980
0.128
+0.031
32.19%
jan 1, 1981
0.132
+0.004
3.28%
jan 1, 1982
0.06
-0.073
-54.92%
jan 1, 1983
0.082
+0.022
37.46%
jan 1, 1984
0.099
+0.017
21.2%
jan 1, 1985
0.226
+0.127
127.81%
jan 1, 1986
0.364
+0.138
60.97%
jan 1, 1987
0.464
+0.1
27.53%
jan 1, 1988
0.598
+0.134
28.83%
jan 1, 1989
0.685
+0.087
14.63%
jan 1, 1990
0.745
+0.059
8.65%
jan 1, 1991
0.65
-0.095
-12.7%
jan 1, 1992
0.774
+0.123
18.97%
jan 1, 1993
0.842
+0.069
8.86%
jan 1, 1994
0.859
+0.017
1.96%
jan 1, 1995
1.052
+0.193
22.49%
jan 1, 1996
1.041
-0.011
-1.02%
jan 1, 1997
1.389
+0.348
33.41%
jan 1, 1998
1.672
+0.283
20.41%
jan 1, 1999
1.721
+0.048
2.9%
jan 1, 2000
1.838
+0.117
6.81%
jan 1, 2008
2.995
+1.157
62.94%
jan 1, 2010
2.889
-0.106
-3.54%
jan 1, 2011
2.775
-0.114
-3.95%
jan 1, 2012
3.07
+0.296
10.66%
jan 1, 2013
3.629
+0.559
18.2%
jan 1, 2014
3.989
+0.36
9.93%
jan 1, 2015
4.172
+0.182
4.57%
Ranking of countries by current statistics by years


Comments: