29
/
en
AIzaSyAYiBZKx7MnpbEhh9jyipgxe19OcubqV5w
April 1, 2024
39948
IDA total
IDA
false
2
1
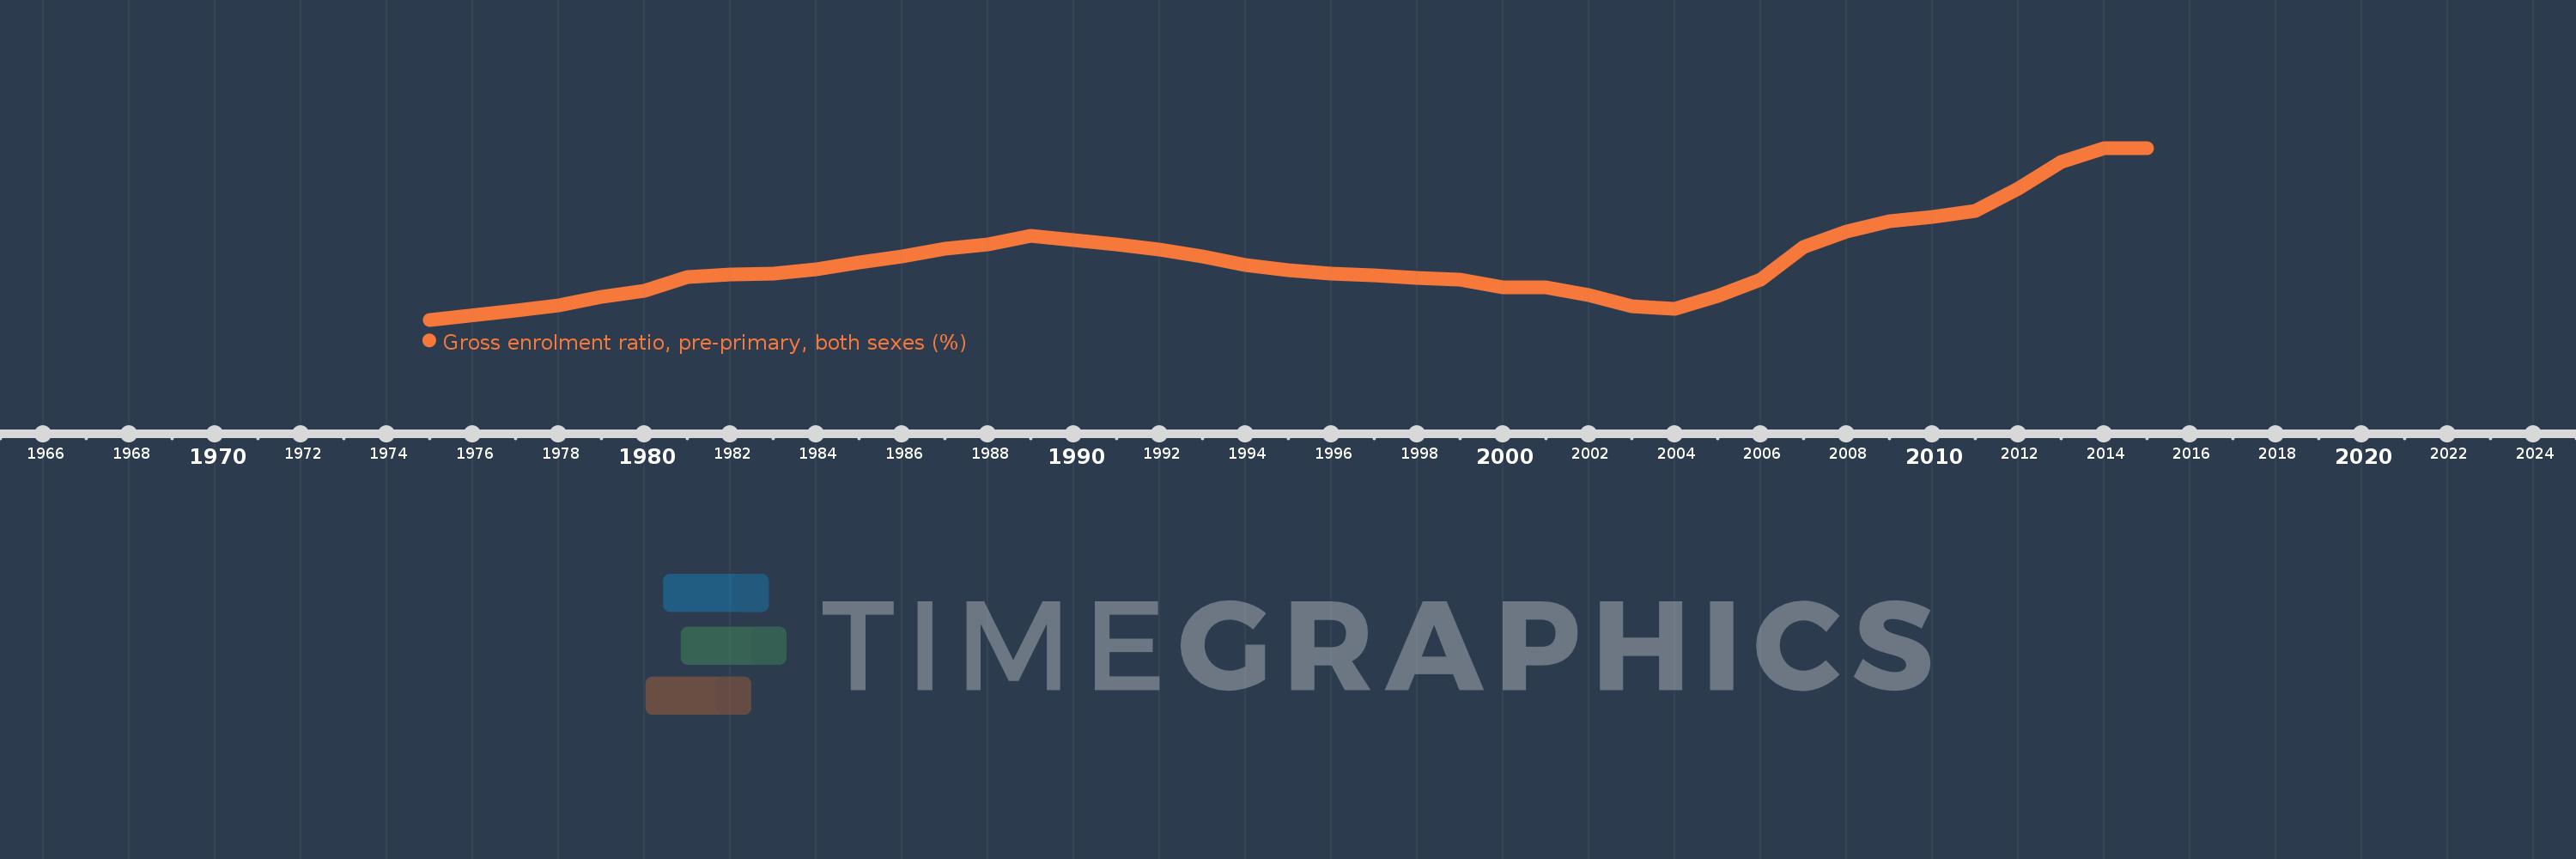
Gross enrolment ratio, pre-primary, both sexes (%)
2015,2014,2013,2012,2011,2010,2009,2008,2007,2006,2005,2004,2003,2002,2001,2000,1999,1998,1997,1996,1995,1994,1993,1992,1991,1990,1989,1988,1987,1986,1985,1984,1983,1982,1981,1980,1979,1978,1977,1975
This statistics in other country:
AfghanistanAlbaniaAlgeriaAndorraAngolaAntigua and BarbudaArab WorldArgentinaArmeniaArubaAustraliaAustriaAzerbaijanBahamas, TheBahrainBangladeshBarbadosBelarusBelgiumBelizeBeninBermudaBhutanBoliviaBosnia and HerzegovinaBotswanaBrazilBritish Virgin IslandsBrunei DarussalamBulgariaBurkina FasoBurundiCabo VerdeCambodiaCameroonCanadaCaribbean small statesCentral African RepublicCentral Europe and the BalticsChadChileChinaColombiaComorosCongo, Dem. Rep.Congo, Rep.Costa RicaCote d'IvoireCroatiaCubaCyprusCzech RepublicDenmarkDjiboutiDominicaDominican RepublicEarly-demographic dividendEast Asia & PacificEast Asia & Pacific (excluding high income)East Asia & Pacific (IDA & IBRD countries)EcuadorEgypt, Arab Rep.El SalvadorEquatorial GuineaEritreaEstoniaEthiopiaEuro areaEurope & Central AsiaEurope & Central Asia (excluding high income)Europe & Central Asia (IDA & IBRD countries)European UnionFijiFinlandFragile and conflict affected situationsFranceGabonGambia, TheGeorgiaGermanyGhanaGreeceGrenadaGuatemalaGuineaGuinea-BissauGuyanaHaitiHeavily indebted poor countries (HIPC)High incomeHondurasHong Kong SAR, ChinaHungaryIBRD onlyIcelandIDA & IBRD totalIDA blendIDA onlyIDA totalIndiaIndonesiaIran, Islamic Rep.IraqIrelandIsraelItalyJamaicaJapanJordanKazakhstanKenyaKiribatiKorea, Dem. People’s Rep.Korea, Rep.KuwaitKyrgyz RepublicLao PDRLate-demographic dividendLatin America & Caribbean Latin America & Caribbean (excluding high income)Latin America & the Caribbean (IDA & IBRD countries)LatviaLeast developed countries: UN classificationLebanonLesothoLiberiaLibyaLiechtensteinLithuaniaLow & middle incomeLow incomeLower middle incomeLuxembourgMacao SAR, ChinaMacedonia, FYRMadagascarMalaysiaMaldivesMaliMaltaMarshall IslandsMauritaniaMauritiusMexicoMicronesia, Fed. Sts.Middle East & North AfricaMiddle East & North Africa (excluding high income)Middle East & North Africa (IDA & IBRD countries)Middle incomeMoldovaMongoliaMontenegroMoroccoMozambiqueMyanmarNamibiaNauruNepalNetherlandsNew ZealandNicaraguaNigerNigeriaNorth AmericaNorwayOECD membersOmanOther small statesPacific island small statesPakistanPalauPanamaPapua New GuineaParaguayPeruPhilippinesPolandPortugalPost-demographic dividendPre-demographic dividendPuerto RicoQatarRomaniaRussian FederationRwandaSamoaSan MarinoSao Tome and PrincipeSaudi ArabiaSenegalSerbiaSeychellesSierra LeoneSlovak RepublicSloveniaSmall statesSolomon IslandsSomaliaSouth AfricaSouth AsiaSouth Asia (IDA & IBRD)South SudanSpainSri LankaSt. Kitts and NevisSt. LuciaSt. Vincent and the GrenadinesSub-Saharan Africa Sub-Saharan Africa (excluding high income)Sub-Saharan Africa (IDA & IBRD countries)SudanSurinameSwazilandSwedenSwitzerlandSyrian Arab RepublicTajikistanTanzaniaThailandTimor-LesteTogoTongaTrinidad and TobagoTunisiaTurkeyTurkmenistanTuvaluUgandaUkraineUnited Arab EmiratesUnited KingdomUnited StatesUpper middle incomeUruguayUzbekistanVanuatuVenezuela, RBVietnamWest Bank and GazaWorldYemen, Rep.ZambiaZimbabwe Timeline:
This timeline shows a graph from 1975 to 2015 of IDA total. No data until 1974. Number of actual observations by date: 40.
Source name:
World Development Indicators
Source organization:
UNESCO Institute for Statistics
Categories, topics:
Education
Last updated:
apr 23, 2017
Indicators value changes by year
Minimum:
15.818
jan 1, 1975
Maximum:
28.348
jan 1, 2015
At the date of observation
Value
Absolute change
Change from previous value
jan 1, 1975
15.818
+15.818
0.0%
jan 1, 1977
16.515
+0.697
4.41%
jan 1, 1978
16.847
+0.331
2.01%
jan 1, 1979
17.512
+0.666
3.95%
jan 1, 1980
17.948
+0.436
2.49%
jan 1, 1981
18.933
+0.984
5.48%
jan 1, 1982
19.132
+0.199
1.05%
jan 1, 1983
19.2
+0.069
0.36%
jan 1, 1984
19.496
+0.295
1.54%
jan 1, 1985
19.995
+0.499
2.56%
jan 1, 1986
20.455
+0.461
2.3%
jan 1, 1987
20.975
+0.52
2.54%
jan 1, 1988
21.33
+0.355
1.69%
jan 1, 1989
21.929
+0.599
2.81%
jan 1, 1990
21.636
-0.293
-1.34%
jan 1, 1991
21.299
-0.337
-1.56%
jan 1, 1992
20.908
-0.392
-1.84%
jan 1, 1993
20.42
-0.488
-2.33%
jan 1, 1994
19.82
-0.6
-2.94%
jan 1, 1995
19.423
-0.397
-2.0%
jan 1, 1996
19.187
-0.236
-1.22%
jan 1, 1997
19.065
-0.122
-0.64%
jan 1, 1998
18.876
-0.189
-0.99%
jan 1, 1999
18.729
-0.147
-0.78%
jan 1, 2000
18.186
-0.543
-2.9%
jan 1, 2001
18.194
+0.009
0.05%
jan 1, 2002
17.613
-0.581
-3.19%
jan 1, 2003
16.805
-0.808
-4.59%
jan 1, 2004
16.63
-0.175
-1.04%
jan 1, 2005
17.579
+0.949
5.71%
jan 1, 2006
18.729
+1.15
6.54%
jan 1, 2007
21.129
+2.401
12.82%
jan 1, 2008
22.234
+1.105
5.23%
jan 1, 2009
22.975
+0.741
3.33%
jan 1, 2010
23.326
+0.35
1.53%
jan 1, 2011
23.782
+0.456
1.96%
jan 1, 2012
25.363
+1.581
6.65%
jan 1, 2013
27.354
+1.992
7.85%
jan 1, 2014
28.344
+0.989
3.62%
jan 1, 2015
28.348
+0.004
0.01%
Ranking of countries by current statistics by years


Comments: