29
/
en
AIzaSyAYiBZKx7MnpbEhh9jyipgxe19OcubqV5w
April 1, 2024
209368
New Zealand
NZL
true
2
1
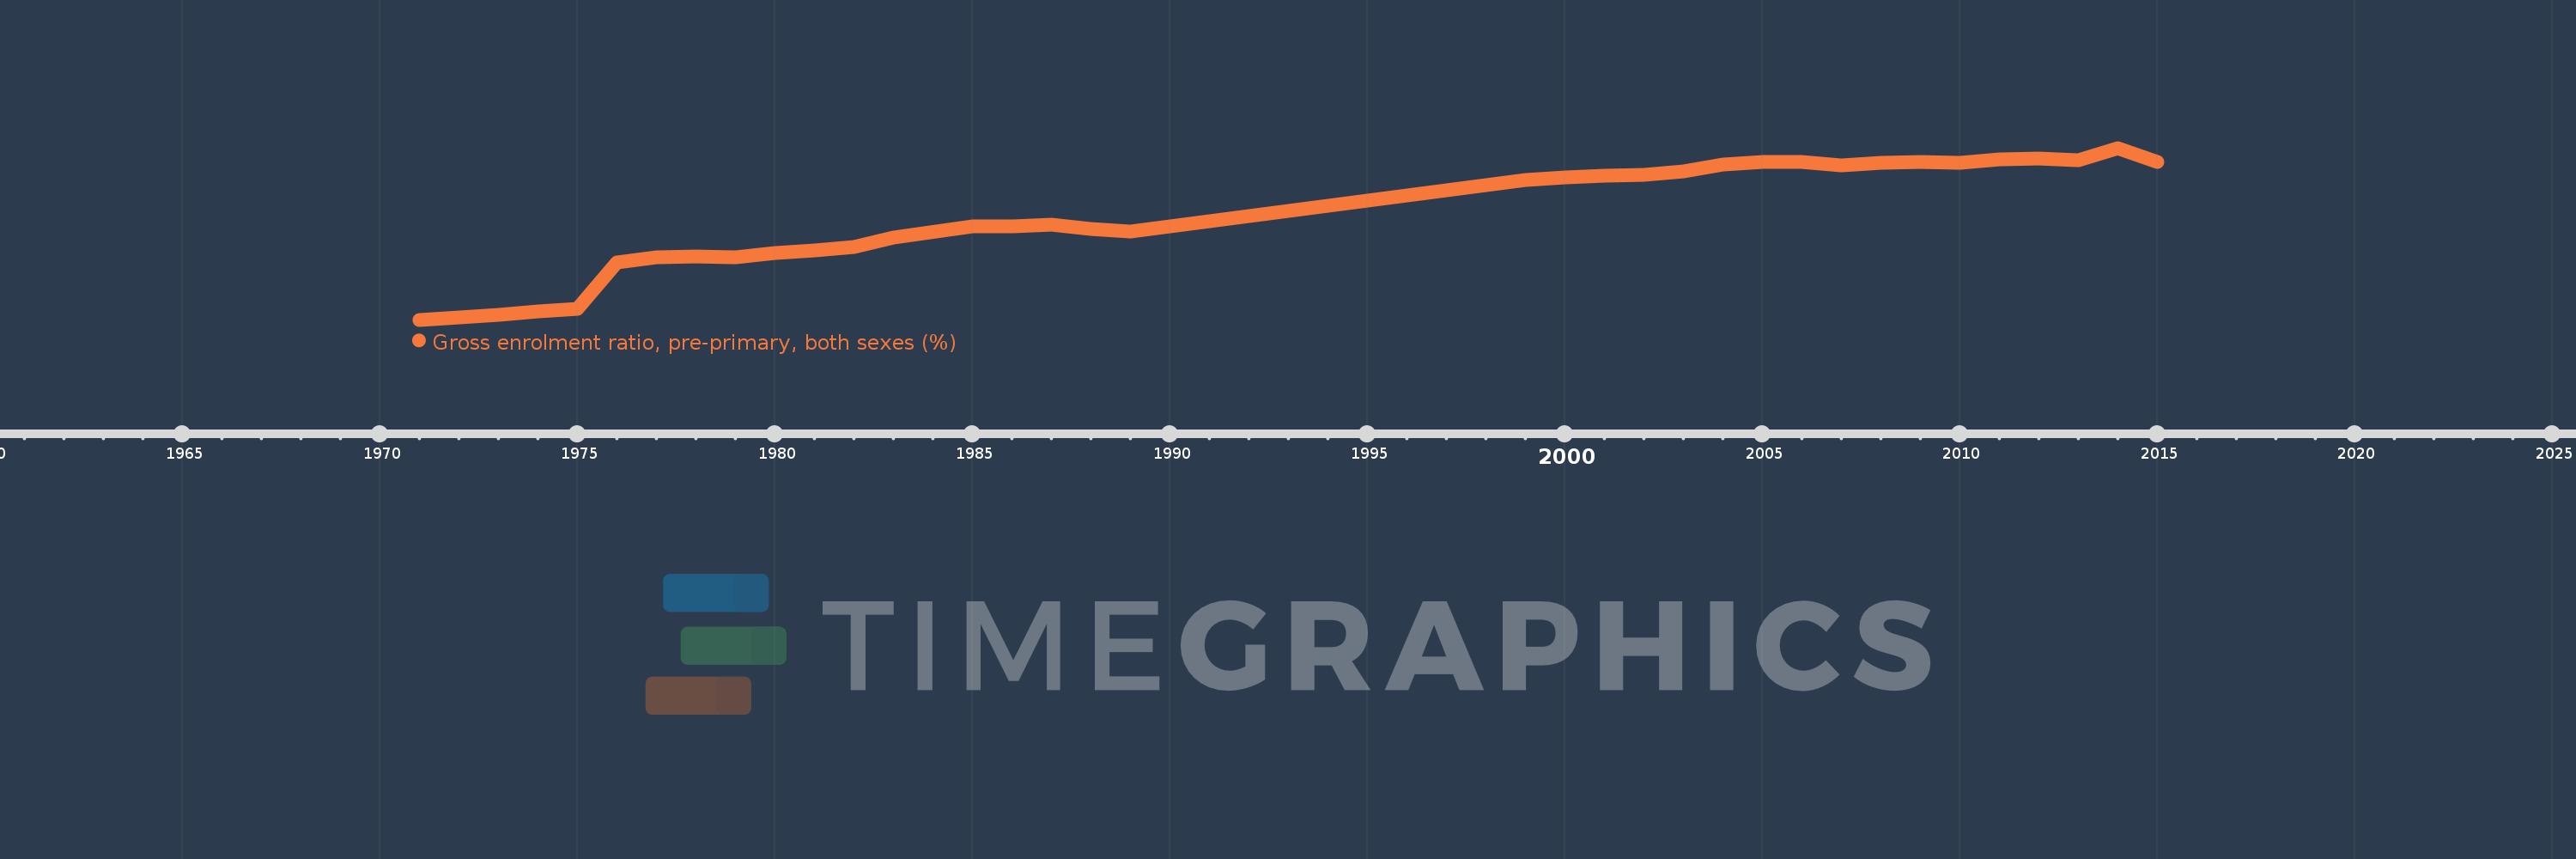
Gross enrolment ratio, pre-primary, both sexes (%)
2015,2014,2013,2012,2011,2010,2009,2008,2007,2006,2005,2004,2003,2002,2001,2000,1999,1989,1988,1987,1986,1985,1983,1982,1981,1980,1979,1978,1977,1976,1975,1974,1973,1972,1971
This statistics in other country:
AfghanistanAlbaniaAlgeriaAndorraAngolaAntigua and BarbudaArab WorldArgentinaArmeniaArubaAustraliaAustriaAzerbaijanBahamas, TheBahrainBangladeshBarbadosBelarusBelgiumBelizeBeninBermudaBhutanBoliviaBosnia and HerzegovinaBotswanaBrazilBritish Virgin IslandsBrunei DarussalamBulgariaBurkina FasoBurundiCabo VerdeCambodiaCameroonCanadaCaribbean small statesCentral African RepublicCentral Europe and the BalticsChadChileChinaColombiaComorosCongo, Dem. Rep.Congo, Rep.Costa RicaCote d'IvoireCroatiaCubaCyprusCzech RepublicDenmarkDjiboutiDominicaDominican RepublicEarly-demographic dividendEast Asia & PacificEast Asia & Pacific (excluding high income)East Asia & Pacific (IDA & IBRD countries)EcuadorEgypt, Arab Rep.El SalvadorEquatorial GuineaEritreaEstoniaEthiopiaEuro areaEurope & Central AsiaEurope & Central Asia (excluding high income)Europe & Central Asia (IDA & IBRD countries)European UnionFijiFinlandFragile and conflict affected situationsFranceGabonGambia, TheGeorgiaGermanyGhanaGreeceGrenadaGuatemalaGuineaGuinea-BissauGuyanaHaitiHeavily indebted poor countries (HIPC)High incomeHondurasHong Kong SAR, ChinaHungaryIBRD onlyIcelandIDA & IBRD totalIDA blendIDA onlyIDA totalIndiaIndonesiaIran, Islamic Rep.IraqIrelandIsraelItalyJamaicaJapanJordanKazakhstanKenyaKiribatiKorea, Dem. People’s Rep.Korea, Rep.KuwaitKyrgyz RepublicLao PDRLate-demographic dividendLatin America & Caribbean Latin America & Caribbean (excluding high income)Latin America & the Caribbean (IDA & IBRD countries)LatviaLeast developed countries: UN classificationLebanonLesothoLiberiaLibyaLiechtensteinLithuaniaLow & middle incomeLow incomeLower middle incomeLuxembourgMacao SAR, ChinaMacedonia, FYRMadagascarMalaysiaMaldivesMaliMaltaMarshall IslandsMauritaniaMauritiusMexicoMicronesia, Fed. Sts.Middle East & North AfricaMiddle East & North Africa (excluding high income)Middle East & North Africa (IDA & IBRD countries)Middle incomeMoldovaMongoliaMontenegroMoroccoMozambiqueMyanmarNamibiaNauruNepalNetherlandsNew ZealandNicaraguaNigerNigeriaNorth AmericaNorwayOECD membersOmanOther small statesPacific island small statesPakistanPalauPanamaPapua New GuineaParaguayPeruPhilippinesPolandPortugalPost-demographic dividendPre-demographic dividendPuerto RicoQatarRomaniaRussian FederationRwandaSamoaSan MarinoSao Tome and PrincipeSaudi ArabiaSenegalSerbiaSeychellesSierra LeoneSlovak RepublicSloveniaSmall statesSolomon IslandsSomaliaSouth AfricaSouth AsiaSouth Asia (IDA & IBRD)South SudanSpainSri LankaSt. Kitts and NevisSt. LuciaSt. Vincent and the GrenadinesSub-Saharan Africa Sub-Saharan Africa (excluding high income)Sub-Saharan Africa (IDA & IBRD countries)SudanSurinameSwazilandSwedenSwitzerlandSyrian Arab RepublicTajikistanTanzaniaThailandTimor-LesteTogoTongaTrinidad and TobagoTunisiaTurkeyTurkmenistanTuvaluUgandaUkraineUnited Arab EmiratesUnited KingdomUnited StatesUpper middle incomeUruguayUzbekistanVanuatuVenezuela, RBVietnamWest Bank and GazaWorldYemen, Rep.ZambiaZimbabwe Timeline:
This timeline shows a graph from 1971 to 2015 of New Zealand. No data until 1970. Number of actual observations by date: 35.
Source name:
World Development Indicators
Source organization:
UNESCO Institute for Statistics
Categories, topics:
Education
Last updated:
apr 23, 2017
Indicators value changes by year
Minimum:
20.265
jan 1, 1971
Maximum:
98.011
jan 1, 2014
At the date of observation
Value
Absolute change
Change from previous value
jan 1, 1971
20.265
+20.265
0.0%
jan 1, 1972
21.302
+1.037
5.12%
jan 1, 1973
22.495
+1.193
5.6%
jan 1, 1974
24.019
+1.524
6.77%
jan 1, 1975
25.262
+1.244
5.18%
jan 1, 1976
46.125
+20.862
82.58%
jan 1, 1977
48.643
+2.518
5.46%
jan 1, 1978
49.018
+0.375
0.77%
jan 1, 1979
48.361
-0.657
-1.34%
jan 1, 1980
50.565
+2.204
4.56%
jan 1, 1981
51.669
+1.104
2.18%
jan 1, 1982
53.137
+1.468
2.84%
jan 1, 1983
57.362
+4.225
7.95%
jan 1, 1985
62.366
+5.004
8.72%
jan 1, 1986
62.673
+0.307
0.49%
jan 1, 1987
63.155
+0.482
0.77%
jan 1, 1988
61.17
-1.985
-3.14%
jan 1, 1989
60.262
-0.909
-1.49%
jan 1, 1999
83.658
+23.397
38.83%
jan 1, 2000
84.811
+1.153
1.38%
jan 1, 2001
85.502
+0.691
0.81%
jan 1, 2002
85.809
+0.307
0.36%
jan 1, 2003
87.458
+1.65
1.92%
jan 1, 2004
90.516
+3.058
3.5%
jan 1, 2005
91.727
+1.211
1.34%
jan 1, 2006
91.746
+0.018
0.02%
jan 1, 2007
90.281
-1.465
-1.6%
jan 1, 2008
91.177
+0.896
0.99%
jan 1, 2009
91.865
+0.689
0.76%
jan 1, 2010
91.211
-0.654
-0.71%
jan 1, 2011
92.975
+1.764
1.93%
jan 1, 2012
93.372
+0.397
0.43%
jan 1, 2013
92.55
-0.821
-0.88%
jan 1, 2014
98.011
+5.46
5.9%
jan 1, 2015
91.82
-6.191
-6.32%
Ranking of countries by current statistics by years


Comments: