29
/
en
AIzaSyAYiBZKx7MnpbEhh9jyipgxe19OcubqV5w
April 1, 2024
47165
Lower middle income
LMC
false
2
1
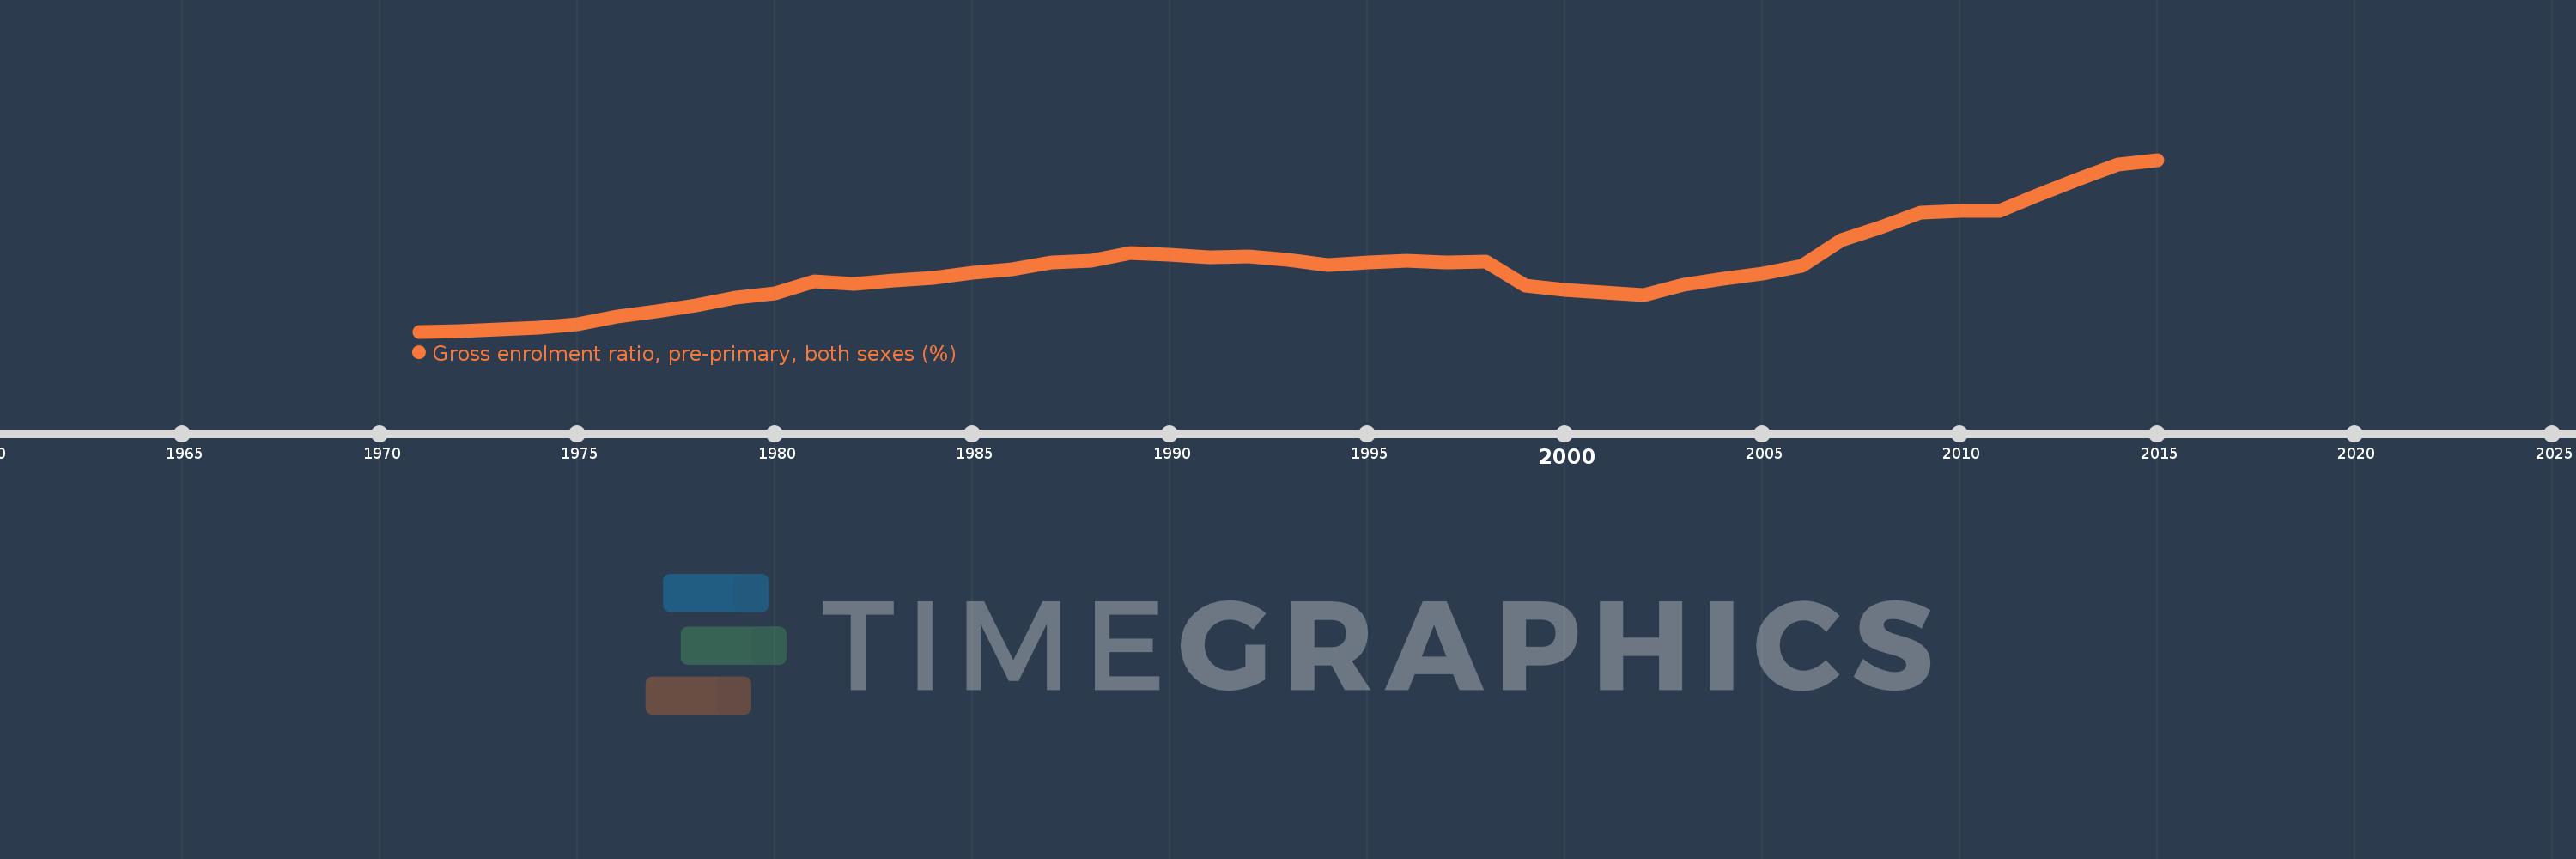
Gross enrolment ratio, pre-primary, both sexes (%)
2015,2014,2013,2012,2011,2010,2009,2008,2007,2006,2005,2004,2003,2002,2001,2000,1999,1998,1997,1996,1995,1994,1993,1992,1991,1990,1989,1988,1987,1986,1985,1984,1983,1982,1981,1980,1979,1978,1977,1976,1975,1974,1973,1972,1971
This statistics in other country:
AfghanistanAlbaniaAlgeriaAndorraAngolaAntigua and BarbudaArab WorldArgentinaArmeniaArubaAustraliaAustriaAzerbaijanBahamas, TheBahrainBangladeshBarbadosBelarusBelgiumBelizeBeninBermudaBhutanBoliviaBosnia and HerzegovinaBotswanaBrazilBritish Virgin IslandsBrunei DarussalamBulgariaBurkina FasoBurundiCabo VerdeCambodiaCameroonCanadaCaribbean small statesCentral African RepublicCentral Europe and the BalticsChadChileChinaColombiaComorosCongo, Dem. Rep.Congo, Rep.Costa RicaCote d'IvoireCroatiaCubaCyprusCzech RepublicDenmarkDjiboutiDominicaDominican RepublicEarly-demographic dividendEast Asia & PacificEast Asia & Pacific (excluding high income)East Asia & Pacific (IDA & IBRD countries)EcuadorEgypt, Arab Rep.El SalvadorEquatorial GuineaEritreaEstoniaEthiopiaEuro areaEurope & Central AsiaEurope & Central Asia (excluding high income)Europe & Central Asia (IDA & IBRD countries)European UnionFijiFinlandFragile and conflict affected situationsFranceGabonGambia, TheGeorgiaGermanyGhanaGreeceGrenadaGuatemalaGuineaGuinea-BissauGuyanaHaitiHeavily indebted poor countries (HIPC)High incomeHondurasHong Kong SAR, ChinaHungaryIBRD onlyIcelandIDA & IBRD totalIDA blendIDA onlyIDA totalIndiaIndonesiaIran, Islamic Rep.IraqIrelandIsraelItalyJamaicaJapanJordanKazakhstanKenyaKiribatiKorea, Dem. People’s Rep.Korea, Rep.KuwaitKyrgyz RepublicLao PDRLate-demographic dividendLatin America & Caribbean Latin America & Caribbean (excluding high income)Latin America & the Caribbean (IDA & IBRD countries)LatviaLeast developed countries: UN classificationLebanonLesothoLiberiaLibyaLiechtensteinLithuaniaLow & middle incomeLow incomeLower middle incomeLuxembourgMacao SAR, ChinaMacedonia, FYRMadagascarMalaysiaMaldivesMaliMaltaMarshall IslandsMauritaniaMauritiusMexicoMicronesia, Fed. Sts.Middle East & North AfricaMiddle East & North Africa (excluding high income)Middle East & North Africa (IDA & IBRD countries)Middle incomeMoldovaMongoliaMontenegroMoroccoMozambiqueMyanmarNamibiaNauruNepalNetherlandsNew ZealandNicaraguaNigerNigeriaNorth AmericaNorwayOECD membersOmanOther small statesPacific island small statesPakistanPalauPanamaPapua New GuineaParaguayPeruPhilippinesPolandPortugalPost-demographic dividendPre-demographic dividendPuerto RicoQatarRomaniaRussian FederationRwandaSamoaSan MarinoSao Tome and PrincipeSaudi ArabiaSenegalSerbiaSeychellesSierra LeoneSlovak RepublicSloveniaSmall statesSolomon IslandsSomaliaSouth AfricaSouth AsiaSouth Asia (IDA & IBRD)South SudanSpainSri LankaSt. Kitts and NevisSt. LuciaSt. Vincent and the GrenadinesSub-Saharan Africa Sub-Saharan Africa (excluding high income)Sub-Saharan Africa (IDA & IBRD countries)SudanSurinameSwazilandSwedenSwitzerlandSyrian Arab RepublicTajikistanTanzaniaThailandTimor-LesteTogoTongaTrinidad and TobagoTunisiaTurkeyTurkmenistanTuvaluUgandaUkraineUnited Arab EmiratesUnited KingdomUnited StatesUpper middle incomeUruguayUzbekistanVanuatuVenezuela, RBVietnamWest Bank and GazaWorldYemen, Rep.ZambiaZimbabwe Timeline:
This timeline shows a graph from 1971 to 2015 of Lower middle income. No data until 1970. Number of actual observations by date: 45.
Source name:
World Development Indicators
Source organization:
UNESCO Institute for Statistics
Categories, topics:
Education
Last updated:
apr 23, 2017
Indicators value changes by year
Minimum:
11.437
jan 1, 1971
At the date of observation
Value
Absolute change
Change from previous value
jan 1, 1971
11.437
+11.437
0.0%
jan 1, 1972
11.484
+0.047
0.41%
jan 1, 1973
11.633
+0.15
1.3%
jan 1, 1974
11.789
+0.156
1.34%
jan 1, 1975
12.049
+0.259
2.2%
jan 1, 1976
12.76
+0.712
5.91%
jan 1, 1977
13.166
+0.406
3.18%
jan 1, 1978
13.688
+0.522
3.96%
jan 1, 1979
14.385
+0.696
5.09%
jan 1, 1980
14.754
+0.369
2.57%
jan 1, 1981
15.727
+0.973
6.6%
jan 1, 1982
15.571
-0.156
-0.99%
jan 1, 1983
15.835
+0.264
1.7%
jan 1, 1984
16.083
+0.247
1.56%
jan 1, 1985
16.488
+0.405
2.52%
jan 1, 1986
16.825
+0.337
2.04%
jan 1, 1987
17.349
+0.524
3.12%
jan 1, 1988
17.525
+0.176
1.01%
jan 1, 1989
18.215
+0.69
3.94%
jan 1, 1990
18.077
-0.138
-0.76%
jan 1, 1991
17.846
-0.231
-1.28%
jan 1, 1992
17.89
+0.044
0.25%
jan 1, 1993
17.574
-0.316
-1.77%
jan 1, 1994
17.179
-0.395
-2.25%
jan 1, 1995
17.417
+0.238
1.38%
jan 1, 1996
17.527
+0.111
0.64%
jan 1, 1997
17.414
-0.113
-0.65%
jan 1, 1998
17.467
+0.053
0.31%
jan 1, 1999
15.415
-2.053
-11.75%
jan 1, 2000
15.005
-0.409
-2.66%
jan 1, 2001
14.812
-0.193
-1.29%
jan 1, 2002
14.563
-0.249
-1.68%
jan 1, 2003
15.435
+0.872
5.99%
jan 1, 2004
16.011
+0.576
3.73%
jan 1, 2005
16.414
+0.402
2.51%
jan 1, 2006
17.091
+0.678
4.13%
jan 1, 2007
19.286
+2.195
12.84%
jan 1, 2008
20.381
+1.095
5.68%
jan 1, 2009
21.676
+1.295
6.35%
jan 1, 2010
21.783
+0.108
0.5%
jan 1, 2011
21.813
+0.03
0.14%
jan 1, 2012
23.23
+1.417
6.49%
jan 1, 2013
24.547
+1.317
5.67%
jan 1, 2014
25.825
+1.278
5.2%
jan 1, 2015
26.21
+0.386
1.49%
Ranking of countries by current statistics by years


Comments: