29
/
en
AIzaSyAYiBZKx7MnpbEhh9jyipgxe19OcubqV5w
April 1, 2024
118963
Denmark
DNK
true
2
1
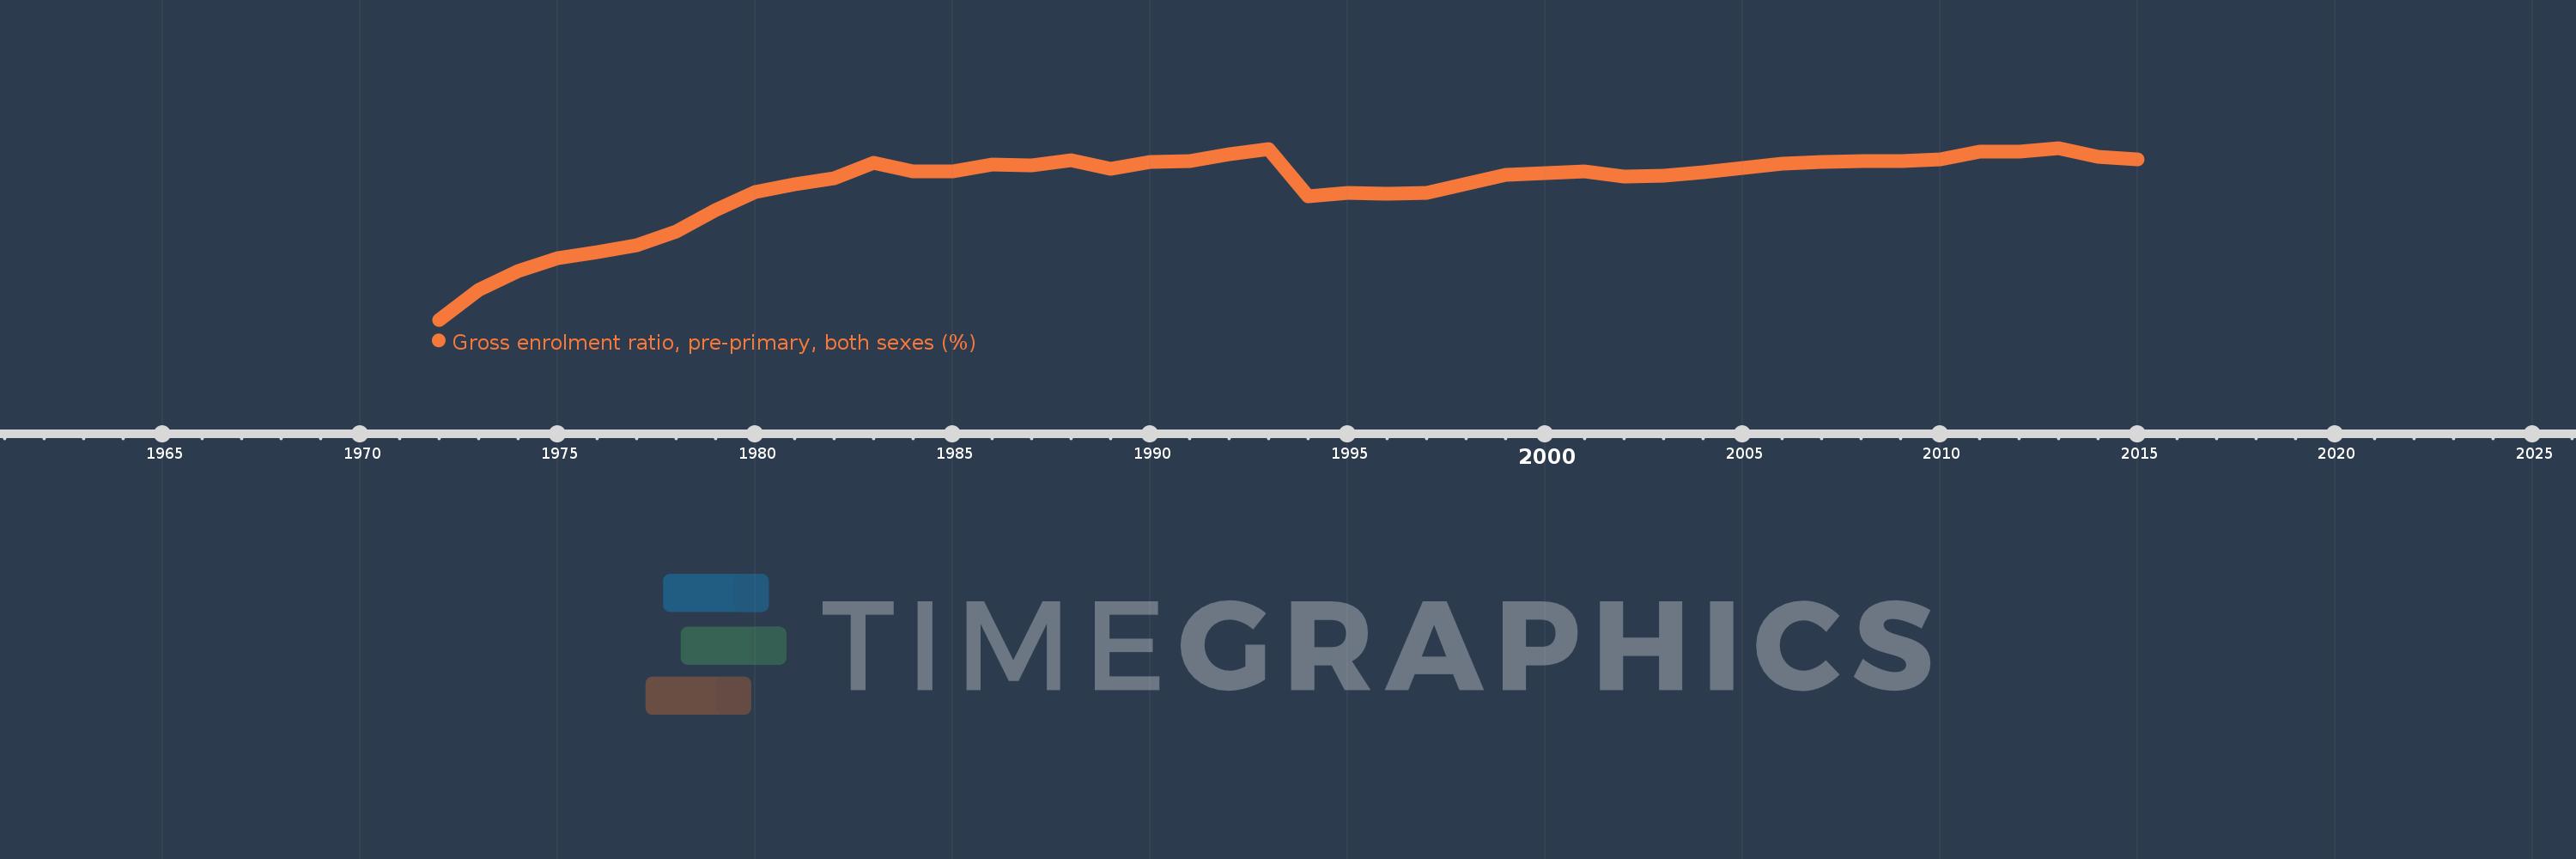
Gross enrolment ratio, pre-primary, both sexes (%)
2015,2014,2013,2012,2011,2010,2009,2008,2007,2006,2005,2004,2003,2002,2001,2000,1999,1997,1996,1995,1994,1993,1992,1991,1990,1989,1988,1987,1986,1985,1984,1983,1982,1981,1980,1979,1978,1977,1976,1975,1974,1973,1972
This statistics in other country:
AfghanistanAlbaniaAlgeriaAndorraAngolaAntigua and BarbudaArab WorldArgentinaArmeniaArubaAustraliaAustriaAzerbaijanBahamas, TheBahrainBangladeshBarbadosBelarusBelgiumBelizeBeninBermudaBhutanBoliviaBosnia and HerzegovinaBotswanaBrazilBritish Virgin IslandsBrunei DarussalamBulgariaBurkina FasoBurundiCabo VerdeCambodiaCameroonCanadaCaribbean small statesCentral African RepublicCentral Europe and the BalticsChadChileChinaColombiaComorosCongo, Dem. Rep.Congo, Rep.Costa RicaCote d'IvoireCroatiaCubaCyprusCzech RepublicDenmarkDjiboutiDominicaDominican RepublicEarly-demographic dividendEast Asia & PacificEast Asia & Pacific (excluding high income)East Asia & Pacific (IDA & IBRD countries)EcuadorEgypt, Arab Rep.El SalvadorEquatorial GuineaEritreaEstoniaEthiopiaEuro areaEurope & Central AsiaEurope & Central Asia (excluding high income)Europe & Central Asia (IDA & IBRD countries)European UnionFijiFinlandFragile and conflict affected situationsFranceGabonGambia, TheGeorgiaGermanyGhanaGreeceGrenadaGuatemalaGuineaGuinea-BissauGuyanaHaitiHeavily indebted poor countries (HIPC)High incomeHondurasHong Kong SAR, ChinaHungaryIBRD onlyIcelandIDA & IBRD totalIDA blendIDA onlyIDA totalIndiaIndonesiaIran, Islamic Rep.IraqIrelandIsraelItalyJamaicaJapanJordanKazakhstanKenyaKiribatiKorea, Dem. People’s Rep.Korea, Rep.KuwaitKyrgyz RepublicLao PDRLate-demographic dividendLatin America & Caribbean Latin America & Caribbean (excluding high income)Latin America & the Caribbean (IDA & IBRD countries)LatviaLeast developed countries: UN classificationLebanonLesothoLiberiaLibyaLiechtensteinLithuaniaLow & middle incomeLow incomeLower middle incomeLuxembourgMacao SAR, ChinaMacedonia, FYRMadagascarMalaysiaMaldivesMaliMaltaMarshall IslandsMauritaniaMauritiusMexicoMicronesia, Fed. Sts.Middle East & North AfricaMiddle East & North Africa (excluding high income)Middle East & North Africa (IDA & IBRD countries)Middle incomeMoldovaMongoliaMontenegroMoroccoMozambiqueMyanmarNamibiaNauruNepalNetherlandsNew ZealandNicaraguaNigerNigeriaNorth AmericaNorwayOECD membersOmanOther small statesPacific island small statesPakistanPalauPanamaPapua New GuineaParaguayPeruPhilippinesPolandPortugalPost-demographic dividendPre-demographic dividendPuerto RicoQatarRomaniaRussian FederationRwandaSamoaSan MarinoSao Tome and PrincipeSaudi ArabiaSenegalSerbiaSeychellesSierra LeoneSlovak RepublicSloveniaSmall statesSolomon IslandsSomaliaSouth AfricaSouth AsiaSouth Asia (IDA & IBRD)South SudanSpainSri LankaSt. Kitts and NevisSt. LuciaSt. Vincent and the GrenadinesSub-Saharan Africa Sub-Saharan Africa (excluding high income)Sub-Saharan Africa (IDA & IBRD countries)SudanSurinameSwazilandSwedenSwitzerlandSyrian Arab RepublicTajikistanTanzaniaThailandTimor-LesteTogoTongaTrinidad and TobagoTunisiaTurkeyTurkmenistanTuvaluUgandaUkraineUnited Arab EmiratesUnited KingdomUnited StatesUpper middle incomeUruguayUzbekistanVanuatuVenezuela, RBVietnamWest Bank and GazaWorldYemen, Rep.ZambiaZimbabwe Timeline:
This timeline shows a graph from 1972 to 2015 of Denmark. No data until 1971. Number of actual observations by date: 43.
Source name:
World Development Indicators
Source organization:
UNESCO Institute for Statistics
Categories, topics:
Education
Last updated:
apr 23, 2017
Indicators value changes by year
Minimum:
26.159
jan 1, 1972
Maximum:
101.518
jan 1, 2013
At the date of observation
Value
Absolute change
Change from previous value
jan 1, 1972
26.159
+26.159
0.0%
jan 1, 1973
39.322
+13.164
50.32%
jan 1, 1974
47.63
+8.307
21.13%
jan 1, 1975
52.99
+5.36
11.25%
jan 1, 1976
55.75
+2.76
5.21%
jan 1, 1977
58.9
+3.15
5.65%
jan 1, 1978
64.952
+6.052
10.27%
jan 1, 1979
74.17
+9.218
14.19%
jan 1, 1980
82.019
+7.849
10.58%
jan 1, 1981
85.458
+3.439
4.19%
jan 1, 1982
88.256
+2.798
3.27%
jan 1, 1983
94.949
+6.693
7.58%
jan 1, 1984
91.326
-3.623
-3.82%
jan 1, 1985
91.247
-0.079
-0.09%
jan 1, 1986
94.129
+2.882
3.16%
jan 1, 1987
93.831
-0.297
-0.32%
jan 1, 1988
96.181
+2.35
2.5%
jan 1, 1989
92.449
-3.731
-3.88%
jan 1, 1990
95.369
+2.92
3.16%
jan 1, 1991
95.814
+0.445
0.47%
jan 1, 1992
98.767
+2.953
3.08%
jan 1, 1993
100.963
+2.196
2.22%
jan 1, 1994
80.471
-20.492
-20.3%
jan 1, 1995
81.984
+1.513
1.88%
jan 1, 1996
81.356
-0.628
-0.77%
jan 1, 1997
81.819
+0.462
0.57%
jan 1, 1999
89.902
+8.083
9.88%
jan 1, 2000
90.628
+0.727
0.81%
jan 1, 2001
91.134
+0.505
0.56%
jan 1, 2002
88.919
-2.214
-2.43%
jan 1, 2003
89.283
+0.364
0.41%
jan 1, 2004
90.801
+1.518
1.7%
jan 1, 2005
92.631
+1.83
2.02%
jan 1, 2006
94.759
+2.128
2.3%
jan 1, 2007
95.203
+0.444
0.47%
jan 1, 2008
95.663
+0.46
0.48%
jan 1, 2009
95.838
+0.175
0.18%
jan 1, 2010
96.477
+0.639
0.67%
jan 1, 2011
99.888
+3.411
3.54%
jan 1, 2012
99.823
-0.065
-0.06%
jan 1, 2013
101.518
+1.696
1.7%
jan 1, 2014
97.48
-4.039
-3.98%
jan 1, 2015
96.447
-1.033
-1.06%
Ranking of countries by current statistics by years


Comments: