29
/
en
AIzaSyAYiBZKx7MnpbEhh9jyipgxe19OcubqV5w
April 1, 2024
223618
Philippines
PHL
true
2
1
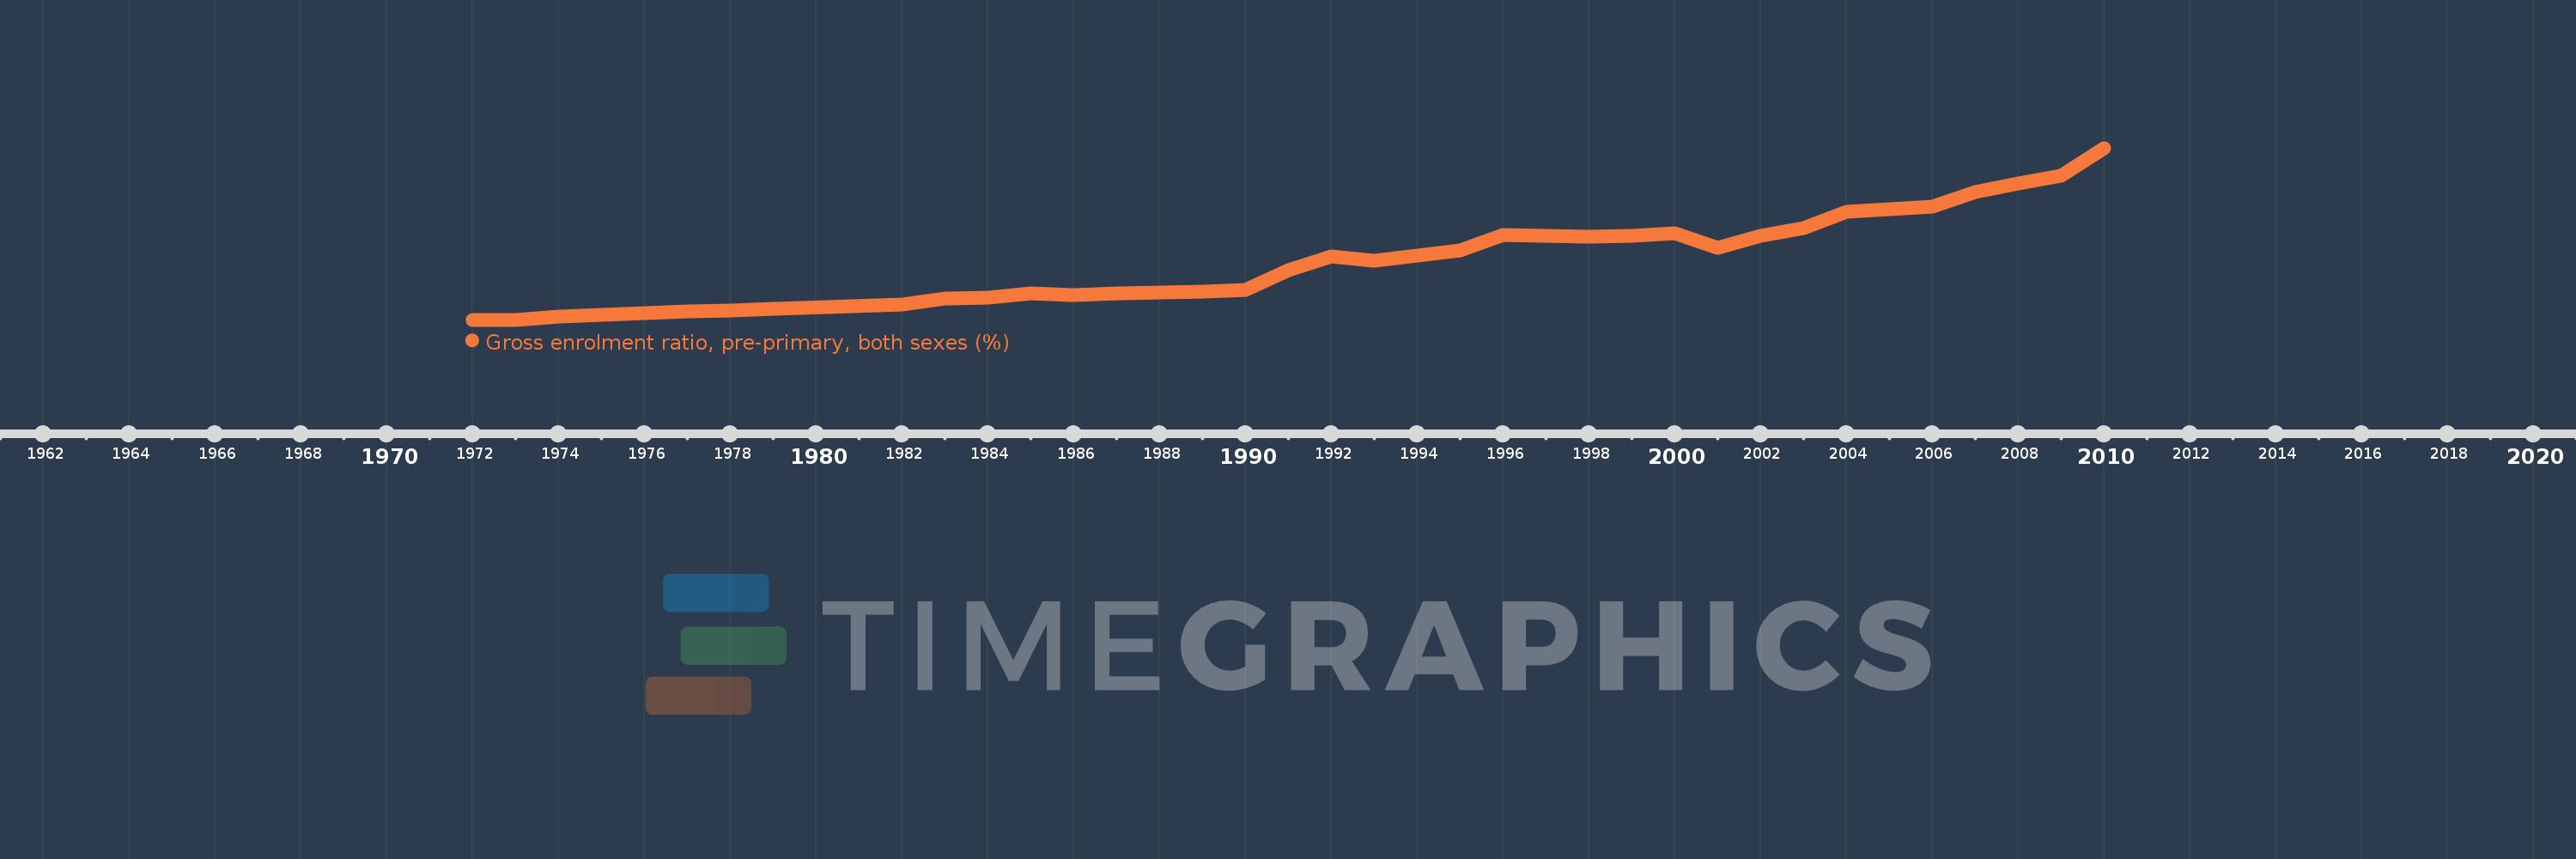
Gross enrolment ratio, pre-primary, both sexes (%)
2010,2009,2008,2007,2006,2005,2004,2003,2002,2001,2000,1999,1998,1997,1996,1995,1994,1993,1992,1991,1990,1989,1988,1987,1986,1985,1984,1983,1982,1979,1978,1977,1976,1975,1974,1973,1972
This statistics in other country:
AfghanistanAlbaniaAlgeriaAndorraAngolaAntigua and BarbudaArab WorldArgentinaArmeniaArubaAustraliaAustriaAzerbaijanBahamas, TheBahrainBangladeshBarbadosBelarusBelgiumBelizeBeninBermudaBhutanBoliviaBosnia and HerzegovinaBotswanaBrazilBritish Virgin IslandsBrunei DarussalamBulgariaBurkina FasoBurundiCabo VerdeCambodiaCameroonCanadaCaribbean small statesCentral African RepublicCentral Europe and the BalticsChadChileChinaColombiaComorosCongo, Dem. Rep.Congo, Rep.Costa RicaCote d'IvoireCroatiaCubaCyprusCzech RepublicDenmarkDjiboutiDominicaDominican RepublicEarly-demographic dividendEast Asia & PacificEast Asia & Pacific (excluding high income)East Asia & Pacific (IDA & IBRD countries)EcuadorEgypt, Arab Rep.El SalvadorEquatorial GuineaEritreaEstoniaEthiopiaEuro areaEurope & Central AsiaEurope & Central Asia (excluding high income)Europe & Central Asia (IDA & IBRD countries)European UnionFijiFinlandFragile and conflict affected situationsFranceGabonGambia, TheGeorgiaGermanyGhanaGreeceGrenadaGuatemalaGuineaGuinea-BissauGuyanaHaitiHeavily indebted poor countries (HIPC)High incomeHondurasHong Kong SAR, ChinaHungaryIBRD onlyIcelandIDA & IBRD totalIDA blendIDA onlyIDA totalIndiaIndonesiaIran, Islamic Rep.IraqIrelandIsraelItalyJamaicaJapanJordanKazakhstanKenyaKiribatiKorea, Dem. People’s Rep.Korea, Rep.KuwaitKyrgyz RepublicLao PDRLate-demographic dividendLatin America & Caribbean Latin America & Caribbean (excluding high income)Latin America & the Caribbean (IDA & IBRD countries)LatviaLeast developed countries: UN classificationLebanonLesothoLiberiaLibyaLiechtensteinLithuaniaLow & middle incomeLow incomeLower middle incomeLuxembourgMacao SAR, ChinaMacedonia, FYRMadagascarMalaysiaMaldivesMaliMaltaMarshall IslandsMauritaniaMauritiusMexicoMicronesia, Fed. Sts.Middle East & North AfricaMiddle East & North Africa (excluding high income)Middle East & North Africa (IDA & IBRD countries)Middle incomeMoldovaMongoliaMontenegroMoroccoMozambiqueMyanmarNamibiaNauruNepalNetherlandsNew ZealandNicaraguaNigerNigeriaNorth AmericaNorwayOECD membersOmanOther small statesPacific island small statesPakistanPalauPanamaPapua New GuineaParaguayPeruPhilippinesPolandPortugalPost-demographic dividendPre-demographic dividendPuerto RicoQatarRomaniaRussian FederationRwandaSamoaSan MarinoSao Tome and PrincipeSaudi ArabiaSenegalSerbiaSeychellesSierra LeoneSlovak RepublicSloveniaSmall statesSolomon IslandsSomaliaSouth AfricaSouth AsiaSouth Asia (IDA & IBRD)South SudanSpainSri LankaSt. Kitts and NevisSt. LuciaSt. Vincent and the GrenadinesSub-Saharan Africa Sub-Saharan Africa (excluding high income)Sub-Saharan Africa (IDA & IBRD countries)SudanSurinameSwazilandSwedenSwitzerlandSyrian Arab RepublicTajikistanTanzaniaThailandTimor-LesteTogoTongaTrinidad and TobagoTunisiaTurkeyTurkmenistanTuvaluUgandaUkraineUnited Arab EmiratesUnited KingdomUnited StatesUpper middle incomeUruguayUzbekistanVanuatuVenezuela, RBVietnamWest Bank and GazaWorldYemen, Rep.ZambiaZimbabwe Timeline:
This timeline shows a graph from 1972 to 2010 of Philippines. No data until 1971. Number of actual observations by date: 37.
Source name:
World Development Indicators
Source organization:
UNESCO Institute for Statistics
Categories, topics:
Education
Last updated:
apr 23, 2017
Indicators value changes by year
Maximum:
54.418
jan 1, 2010
At the date of observation
Value
Absolute change
Change from previous value
jan 1, 1972
4.621
+4.621
0.0%
jan 1, 1973
4.649
+0.028
0.61%
jan 1, 1974
5.473
+0.825
17.74%
jan 1, 1975
5.985
+0.511
9.34%
jan 1, 1976
6.549
+0.564
9.43%
jan 1, 1977
6.957
+0.408
6.23%
jan 1, 1978
7.398
+0.44
6.33%
jan 1, 1979
7.821
+0.423
5.72%
jan 1, 1982
9.074
+1.253
16.02%
jan 1, 1983
10.815
+1.741
19.18%
jan 1, 1984
11.064
+0.249
2.3%
jan 1, 1985
12.286
+1.223
11.05%
jan 1, 1986
11.724
-0.563
-4.58%
jan 1, 1987
12.251
+0.528
4.5%
jan 1, 1988
12.497
+0.245
2.0%
jan 1, 1989
12.665
+0.168
1.35%
jan 1, 1990
13.197
+0.532
4.2%
jan 1, 1991
19.091
+5.894
44.66%
jan 1, 1992
22.918
+3.827
20.05%
jan 1, 1993
21.618
-1.3
-5.67%
jan 1, 1994
23.122
+1.503
6.95%
jan 1, 1995
24.836
+1.715
7.42%
jan 1, 1996
29.148
+4.312
17.36%
jan 1, 1997
28.964
-0.184
-0.63%
jan 1, 1998
28.66
-0.304
-1.05%
jan 1, 1999
28.835
+0.175
0.61%
jan 1, 2000
29.599
+0.764
2.65%
jan 1, 2001
25.421
-4.178
-14.11%
jan 1, 2002
28.959
+3.537
13.92%
jan 1, 2003
31.21
+2.252
7.78%
jan 1, 2004
35.913
+4.703
15.07%
jan 1, 2005
36.656
+0.743
2.07%
jan 1, 2006
37.352
+0.695
1.9%
jan 1, 2007
41.696
+4.344
11.63%
jan 1, 2008
44.057
+2.361
5.66%
jan 1, 2009
46.259
+2.201
5.0%
jan 1, 2010
54.418
+8.159
17.64%
Ranking of countries by current statistics by years


Comments: