29
/
en
AIzaSyAYiBZKx7MnpbEhh9jyipgxe19OcubqV5w
April 1, 2024
242650
Slovenia
SVN
true
2
1
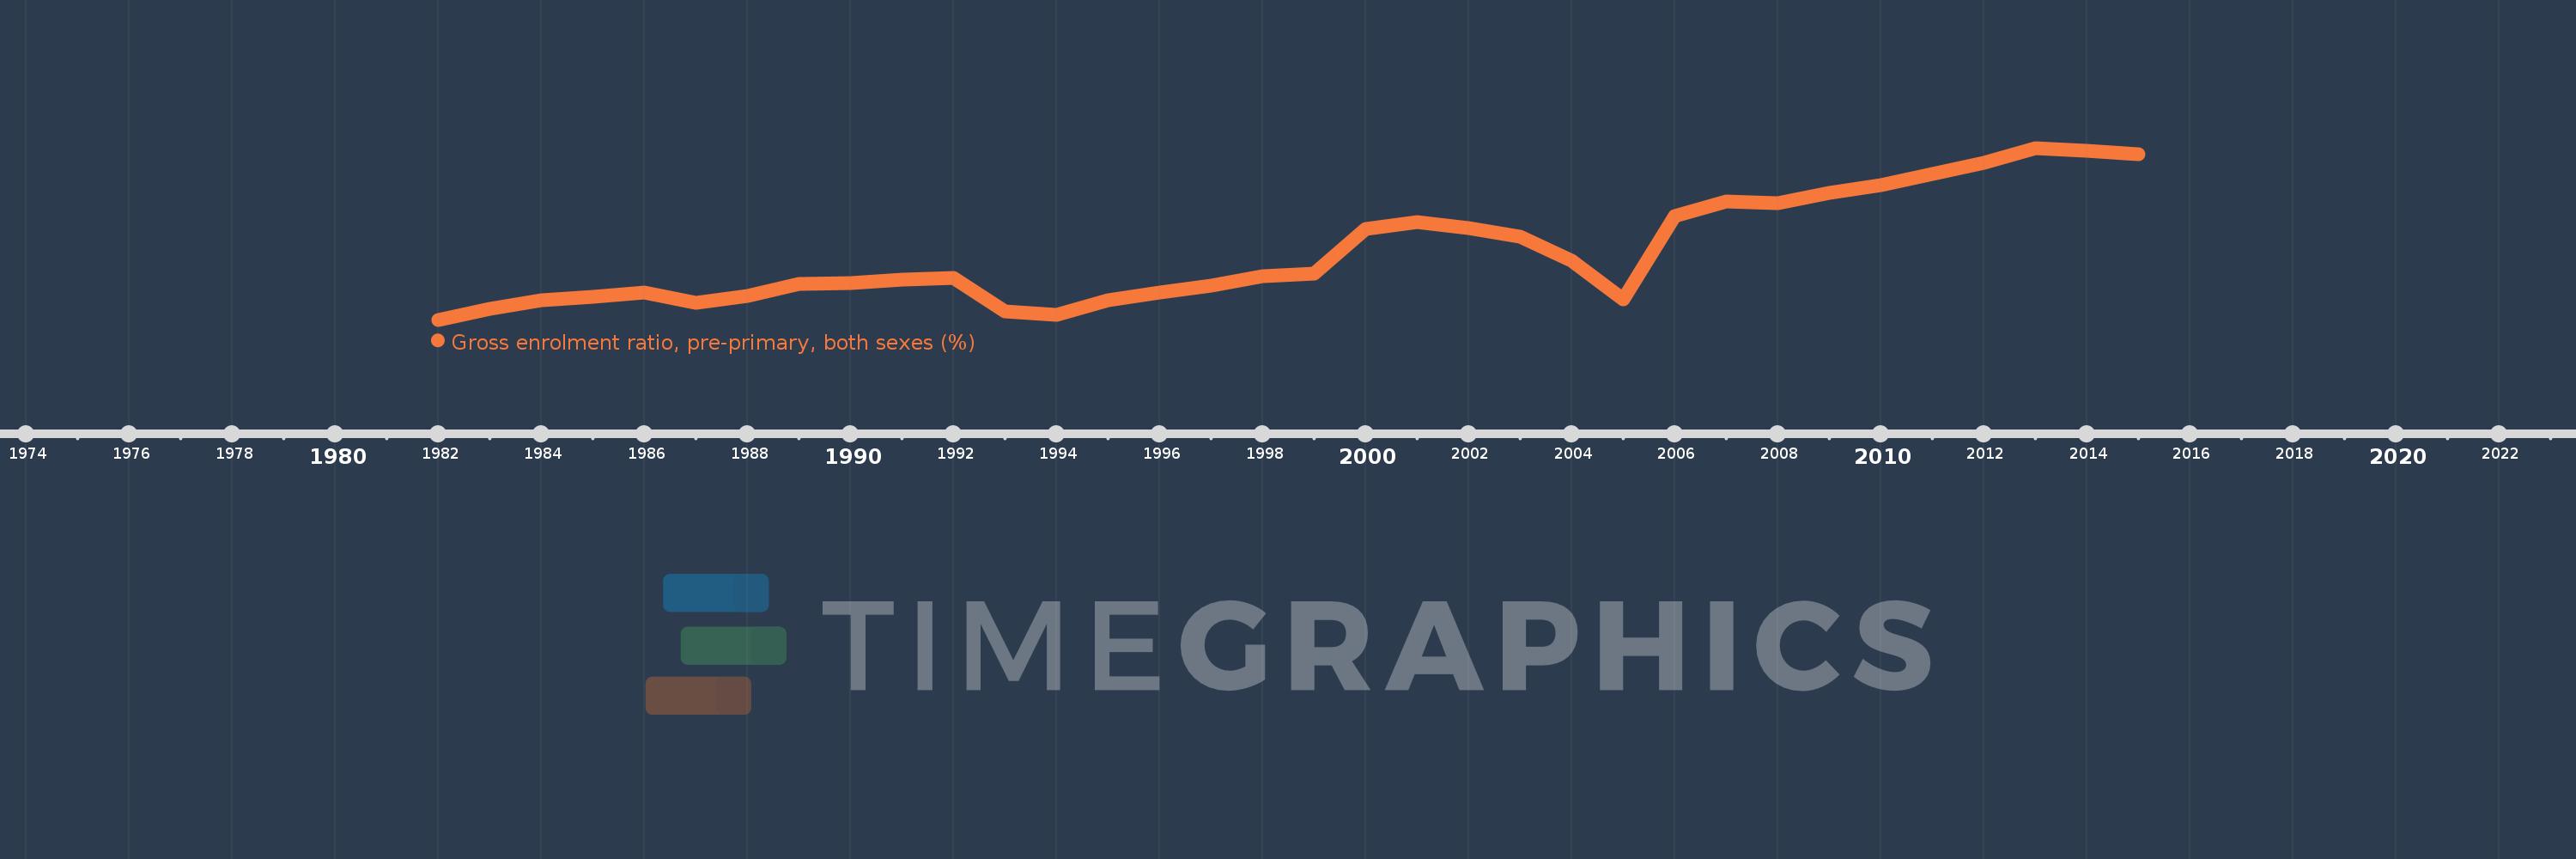
Gross enrolment ratio, pre-primary, both sexes (%)
2015,2014,2013,2012,2011,2010,2009,2008,2007,2006,2005,2004,2003,2002,2001,2000,1999,1998,1997,1996,1995,1994,1993,1992,1991,1990,1989,1988,1987,1986,1985,1984,1983,1982
This statistics in other country:
AfghanistanAlbaniaAlgeriaAndorraAngolaAntigua and BarbudaArab WorldArgentinaArmeniaArubaAustraliaAustriaAzerbaijanBahamas, TheBahrainBangladeshBarbadosBelarusBelgiumBelizeBeninBermudaBhutanBoliviaBosnia and HerzegovinaBotswanaBrazilBritish Virgin IslandsBrunei DarussalamBulgariaBurkina FasoBurundiCabo VerdeCambodiaCameroonCanadaCaribbean small statesCentral African RepublicCentral Europe and the BalticsChadChileChinaColombiaComorosCongo, Dem. Rep.Congo, Rep.Costa RicaCote d'IvoireCroatiaCubaCyprusCzech RepublicDenmarkDjiboutiDominicaDominican RepublicEarly-demographic dividendEast Asia & PacificEast Asia & Pacific (excluding high income)East Asia & Pacific (IDA & IBRD countries)EcuadorEgypt, Arab Rep.El SalvadorEquatorial GuineaEritreaEstoniaEthiopiaEuro areaEurope & Central AsiaEurope & Central Asia (excluding high income)Europe & Central Asia (IDA & IBRD countries)European UnionFijiFinlandFragile and conflict affected situationsFranceGabonGambia, TheGeorgiaGermanyGhanaGreeceGrenadaGuatemalaGuineaGuinea-BissauGuyanaHaitiHeavily indebted poor countries (HIPC)High incomeHondurasHong Kong SAR, ChinaHungaryIBRD onlyIcelandIDA & IBRD totalIDA blendIDA onlyIDA totalIndiaIndonesiaIran, Islamic Rep.IraqIrelandIsraelItalyJamaicaJapanJordanKazakhstanKenyaKiribatiKorea, Dem. People’s Rep.Korea, Rep.KuwaitKyrgyz RepublicLao PDRLate-demographic dividendLatin America & Caribbean Latin America & Caribbean (excluding high income)Latin America & the Caribbean (IDA & IBRD countries)LatviaLeast developed countries: UN classificationLebanonLesothoLiberiaLibyaLiechtensteinLithuaniaLow & middle incomeLow incomeLower middle incomeLuxembourgMacao SAR, ChinaMacedonia, FYRMadagascarMalaysiaMaldivesMaliMaltaMarshall IslandsMauritaniaMauritiusMexicoMicronesia, Fed. Sts.Middle East & North AfricaMiddle East & North Africa (excluding high income)Middle East & North Africa (IDA & IBRD countries)Middle incomeMoldovaMongoliaMontenegroMoroccoMozambiqueMyanmarNamibiaNauruNepalNetherlandsNew ZealandNicaraguaNigerNigeriaNorth AmericaNorwayOECD membersOmanOther small statesPacific island small statesPakistanPalauPanamaPapua New GuineaParaguayPeruPhilippinesPolandPortugalPost-demographic dividendPre-demographic dividendPuerto RicoQatarRomaniaRussian FederationRwandaSamoaSan MarinoSao Tome and PrincipeSaudi ArabiaSenegalSerbiaSeychellesSierra LeoneSlovak RepublicSloveniaSmall statesSolomon IslandsSomaliaSouth AfricaSouth AsiaSouth Asia (IDA & IBRD)South SudanSpainSri LankaSt. Kitts and NevisSt. LuciaSt. Vincent and the GrenadinesSub-Saharan Africa Sub-Saharan Africa (excluding high income)Sub-Saharan Africa (IDA & IBRD countries)SudanSurinameSwazilandSwedenSwitzerlandSyrian Arab RepublicTajikistanTanzaniaThailandTimor-LesteTogoTongaTrinidad and TobagoTunisiaTurkeyTurkmenistanTuvaluUgandaUkraineUnited Arab EmiratesUnited KingdomUnited StatesUpper middle incomeUruguayUzbekistanVanuatuVenezuela, RBVietnamWest Bank and GazaWorldYemen, Rep.ZambiaZimbabwe Timeline:
This timeline shows a graph from 1982 to 2015 of Slovenia. No data until 1981. Number of actual observations by date: 34.
Source name:
World Development Indicators
Source organization:
UNESCO Institute for Statistics
Categories, topics:
Education
Last updated:
apr 23, 2017
Indicators value changes by year
Minimum:
52.379
jan 1, 1982
Maximum:
95.059
jan 1, 2013
At the date of observation
Value
Absolute change
Change from previous value
jan 1, 1982
52.379
+52.379
0.0%
jan 1, 1983
55.055
+2.676
5.11%
jan 1, 1984
57.171
+2.116
3.84%
jan 1, 1985
58.178
+1.007
1.76%
jan 1, 1986
59.18
+1.002
1.72%
jan 1, 1987
56.573
-2.607
-4.41%
jan 1, 1988
58.307
+1.735
3.07%
jan 1, 1989
61.361
+3.054
5.24%
jan 1, 1990
61.513
+0.152
0.25%
jan 1, 1991
62.241
+0.727
1.18%
jan 1, 1992
62.862
+0.622
1.0%
jan 1, 1993
54.477
-8.386
-13.34%
jan 1, 1994
53.525
-0.952
-1.75%
jan 1, 1995
57.202
+3.678
6.87%
jan 1, 1996
59.204
+2.001
3.5%
jan 1, 1997
60.927
+1.723
2.91%
jan 1, 1998
63.153
+2.226
3.65%
jan 1, 1999
63.824
+0.671
1.06%
jan 1, 2000
74.925
+11.101
17.39%
jan 1, 2001
76.573
+1.648
2.2%
jan 1, 2002
75.195
-1.378
-1.8%
jan 1, 2003
73.082
-2.113
-2.81%
jan 1, 2004
67.116
-5.966
-8.16%
jan 1, 2005
57.503
-9.612
-14.32%
jan 1, 2006
78.207
+20.704
36.0%
jan 1, 2007
81.802
+3.595
4.6%
jan 1, 2008
81.297
-0.506
-0.62%
jan 1, 2009
83.962
+2.665
3.28%
jan 1, 2010
85.869
+1.908
2.27%
jan 1, 2011
88.528
+2.659
3.1%
jan 1, 2012
91.355
+2.827
3.19%
jan 1, 2013
95.059
+3.704
4.05%
jan 1, 2014
94.398
-0.661
-0.7%
jan 1, 2015
93.419
-0.979
-1.04%
Ranking of countries by current statistics by years


Comments: