29
/
en
AIzaSyAYiBZKx7MnpbEhh9jyipgxe19OcubqV5w
April 1, 2024
276697
United States
USA
true
2
1
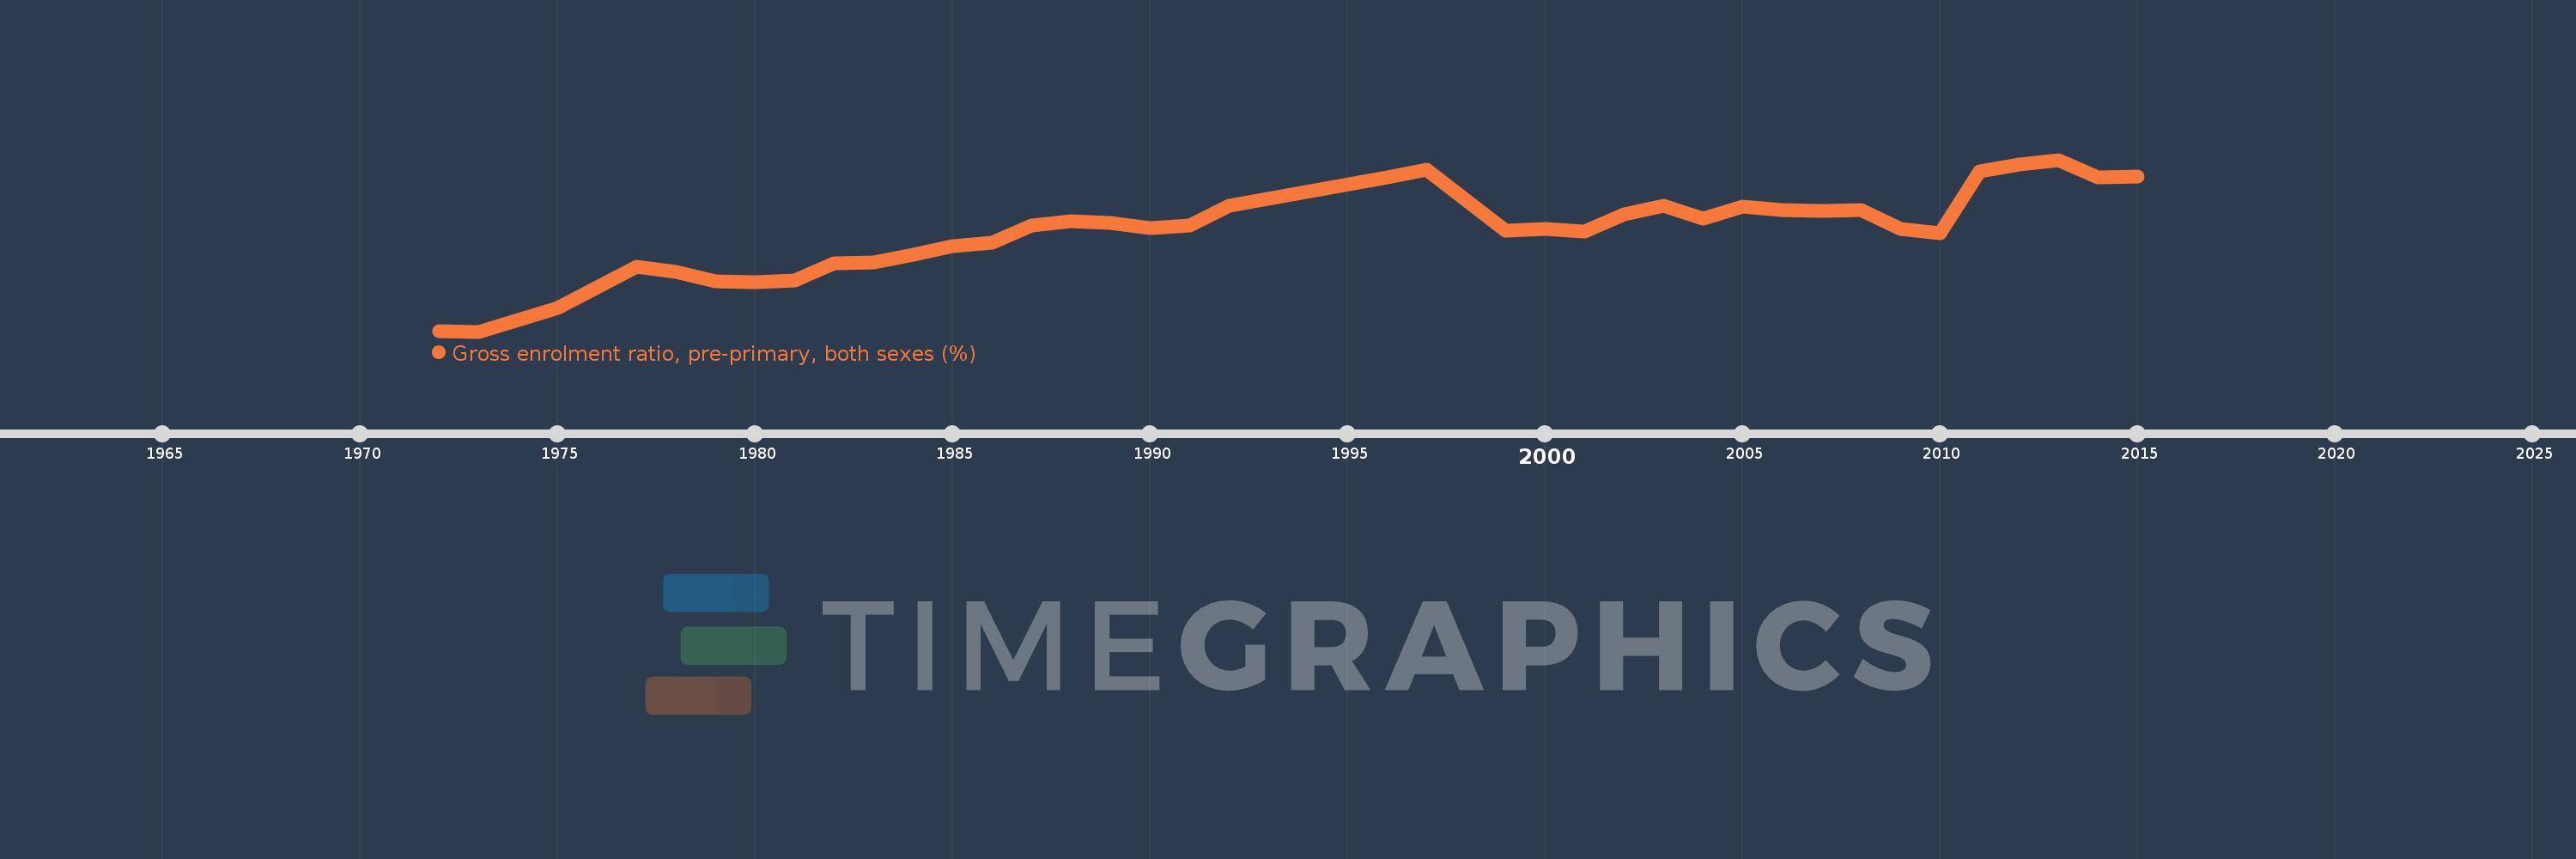
Gross enrolment ratio, pre-primary, both sexes (%)
2015,2014,2013,2012,2011,2010,2009,2008,2007,2006,2005,2004,2003,2002,2001,2000,1999,1997,1996,1992,1991,1990,1989,1988,1987,1986,1985,1984,1983,1982,1981,1980,1979,1978,1977,1975,1973,1972
This statistics in other country:
AfghanistanAlbaniaAlgeriaAndorraAngolaAntigua and BarbudaArab WorldArgentinaArmeniaArubaAustraliaAustriaAzerbaijanBahamas, TheBahrainBangladeshBarbadosBelarusBelgiumBelizeBeninBermudaBhutanBoliviaBosnia and HerzegovinaBotswanaBrazilBritish Virgin IslandsBrunei DarussalamBulgariaBurkina FasoBurundiCabo VerdeCambodiaCameroonCanadaCaribbean small statesCentral African RepublicCentral Europe and the BalticsChadChileChinaColombiaComorosCongo, Dem. Rep.Congo, Rep.Costa RicaCote d'IvoireCroatiaCubaCyprusCzech RepublicDenmarkDjiboutiDominicaDominican RepublicEarly-demographic dividendEast Asia & PacificEast Asia & Pacific (excluding high income)East Asia & Pacific (IDA & IBRD countries)EcuadorEgypt, Arab Rep.El SalvadorEquatorial GuineaEritreaEstoniaEthiopiaEuro areaEurope & Central AsiaEurope & Central Asia (excluding high income)Europe & Central Asia (IDA & IBRD countries)European UnionFijiFinlandFragile and conflict affected situationsFranceGabonGambia, TheGeorgiaGermanyGhanaGreeceGrenadaGuatemalaGuineaGuinea-BissauGuyanaHaitiHeavily indebted poor countries (HIPC)High incomeHondurasHong Kong SAR, ChinaHungaryIBRD onlyIcelandIDA & IBRD totalIDA blendIDA onlyIDA totalIndiaIndonesiaIran, Islamic Rep.IraqIrelandIsraelItalyJamaicaJapanJordanKazakhstanKenyaKiribatiKorea, Dem. People’s Rep.Korea, Rep.KuwaitKyrgyz RepublicLao PDRLate-demographic dividendLatin America & Caribbean Latin America & Caribbean (excluding high income)Latin America & the Caribbean (IDA & IBRD countries)LatviaLeast developed countries: UN classificationLebanonLesothoLiberiaLibyaLiechtensteinLithuaniaLow & middle incomeLow incomeLower middle incomeLuxembourgMacao SAR, ChinaMacedonia, FYRMadagascarMalaysiaMaldivesMaliMaltaMarshall IslandsMauritaniaMauritiusMexicoMicronesia, Fed. Sts.Middle East & North AfricaMiddle East & North Africa (excluding high income)Middle East & North Africa (IDA & IBRD countries)Middle incomeMoldovaMongoliaMontenegroMoroccoMozambiqueMyanmarNamibiaNauruNepalNetherlandsNew ZealandNicaraguaNigerNigeriaNorth AmericaNorwayOECD membersOmanOther small statesPacific island small statesPakistanPalauPanamaPapua New GuineaParaguayPeruPhilippinesPolandPortugalPost-demographic dividendPre-demographic dividendPuerto RicoQatarRomaniaRussian FederationRwandaSamoaSan MarinoSao Tome and PrincipeSaudi ArabiaSenegalSerbiaSeychellesSierra LeoneSlovak RepublicSloveniaSmall statesSolomon IslandsSomaliaSouth AfricaSouth AsiaSouth Asia (IDA & IBRD)South SudanSpainSri LankaSt. Kitts and NevisSt. LuciaSt. Vincent and the GrenadinesSub-Saharan Africa Sub-Saharan Africa (excluding high income)Sub-Saharan Africa (IDA & IBRD countries)SudanSurinameSwazilandSwedenSwitzerlandSyrian Arab RepublicTajikistanTanzaniaThailandTimor-LesteTogoTongaTrinidad and TobagoTunisiaTurkeyTurkmenistanTuvaluUgandaUkraineUnited Arab EmiratesUnited KingdomUnited StatesUpper middle incomeUruguayUzbekistanVanuatuVenezuela, RBVietnamWest Bank and GazaWorldYemen, Rep.ZambiaZimbabwe Timeline:
This timeline shows a graph from 1972 to 2015 of United States. No data until 1971. Number of actual observations by date: 38.
Source name:
World Development Indicators
Source organization:
UNESCO Institute for Statistics
Categories, topics:
Education
Last updated:
apr 23, 2017
Indicators value changes by year
Minimum:
37.587
jan 1, 1973
Maximum:
75.123
jan 1, 2013
At the date of observation
Value
Absolute change
Change from previous value
jan 1, 1972
37.707
+37.707
0.0%
jan 1, 1973
37.587
-0.12
-0.32%
jan 1, 1975
42.752
+5.165
13.74%
jan 1, 1977
51.773
+9.02
21.1%
jan 1, 1978
50.695
-1.077
-2.08%
jan 1, 1979
48.475
-2.22
-4.38%
jan 1, 1980
48.376
-0.099
-0.2%
jan 1, 1981
48.735
+0.358
0.74%
jan 1, 1982
52.542
+3.808
7.81%
jan 1, 1983
52.69
+0.147
0.28%
jan 1, 1984
54.435
+1.745
3.31%
jan 1, 1985
56.305
+1.87
3.44%
jan 1, 1986
56.953
+0.648
1.15%
jan 1, 1987
60.79
+3.837
6.74%
jan 1, 1988
61.619
+0.829
1.36%
jan 1, 1989
61.304
-0.315
-0.51%
jan 1, 1990
60.187
-1.117
-1.82%
jan 1, 1991
60.852
+0.665
1.11%
jan 1, 1992
65.174
+4.322
7.1%
jan 1, 1996
71.253
+6.079
9.33%
jan 1, 1997
73.006
+1.753
2.46%
jan 1, 1999
59.709
-13.298
-18.21%
jan 1, 2000
59.921
+0.212
0.36%
jan 1, 2001
59.424
-0.497
-0.83%
jan 1, 2002
63.226
+3.802
6.4%
jan 1, 2003
65.003
+1.777
2.81%
jan 1, 2004
62.324
-2.678
-4.12%
jan 1, 2005
64.896
+2.571
4.13%
jan 1, 2006
64.221
-0.675
-1.04%
jan 1, 2007
63.955
-0.267
-0.41%
jan 1, 2008
64.103
+0.148
0.23%
jan 1, 2009
60.034
-4.069
-6.35%
jan 1, 2010
59.004
-1.03
-1.72%
jan 1, 2011
72.683
+13.679
23.18%
jan 1, 2012
74.174
+1.491
2.05%
jan 1, 2013
75.123
+0.949
1.28%
jan 1, 2014
71.274
-3.849
-5.12%
jan 1, 2015
71.49
+0.216
0.3%
Ranking of countries by current statistics by years


Comments: