29
/
en
AIzaSyAYiBZKx7MnpbEhh9jyipgxe19OcubqV5w
April 1, 2024
29125
East Asia & Pacific (IDA & IBRD countries)
TEA
false
2
1
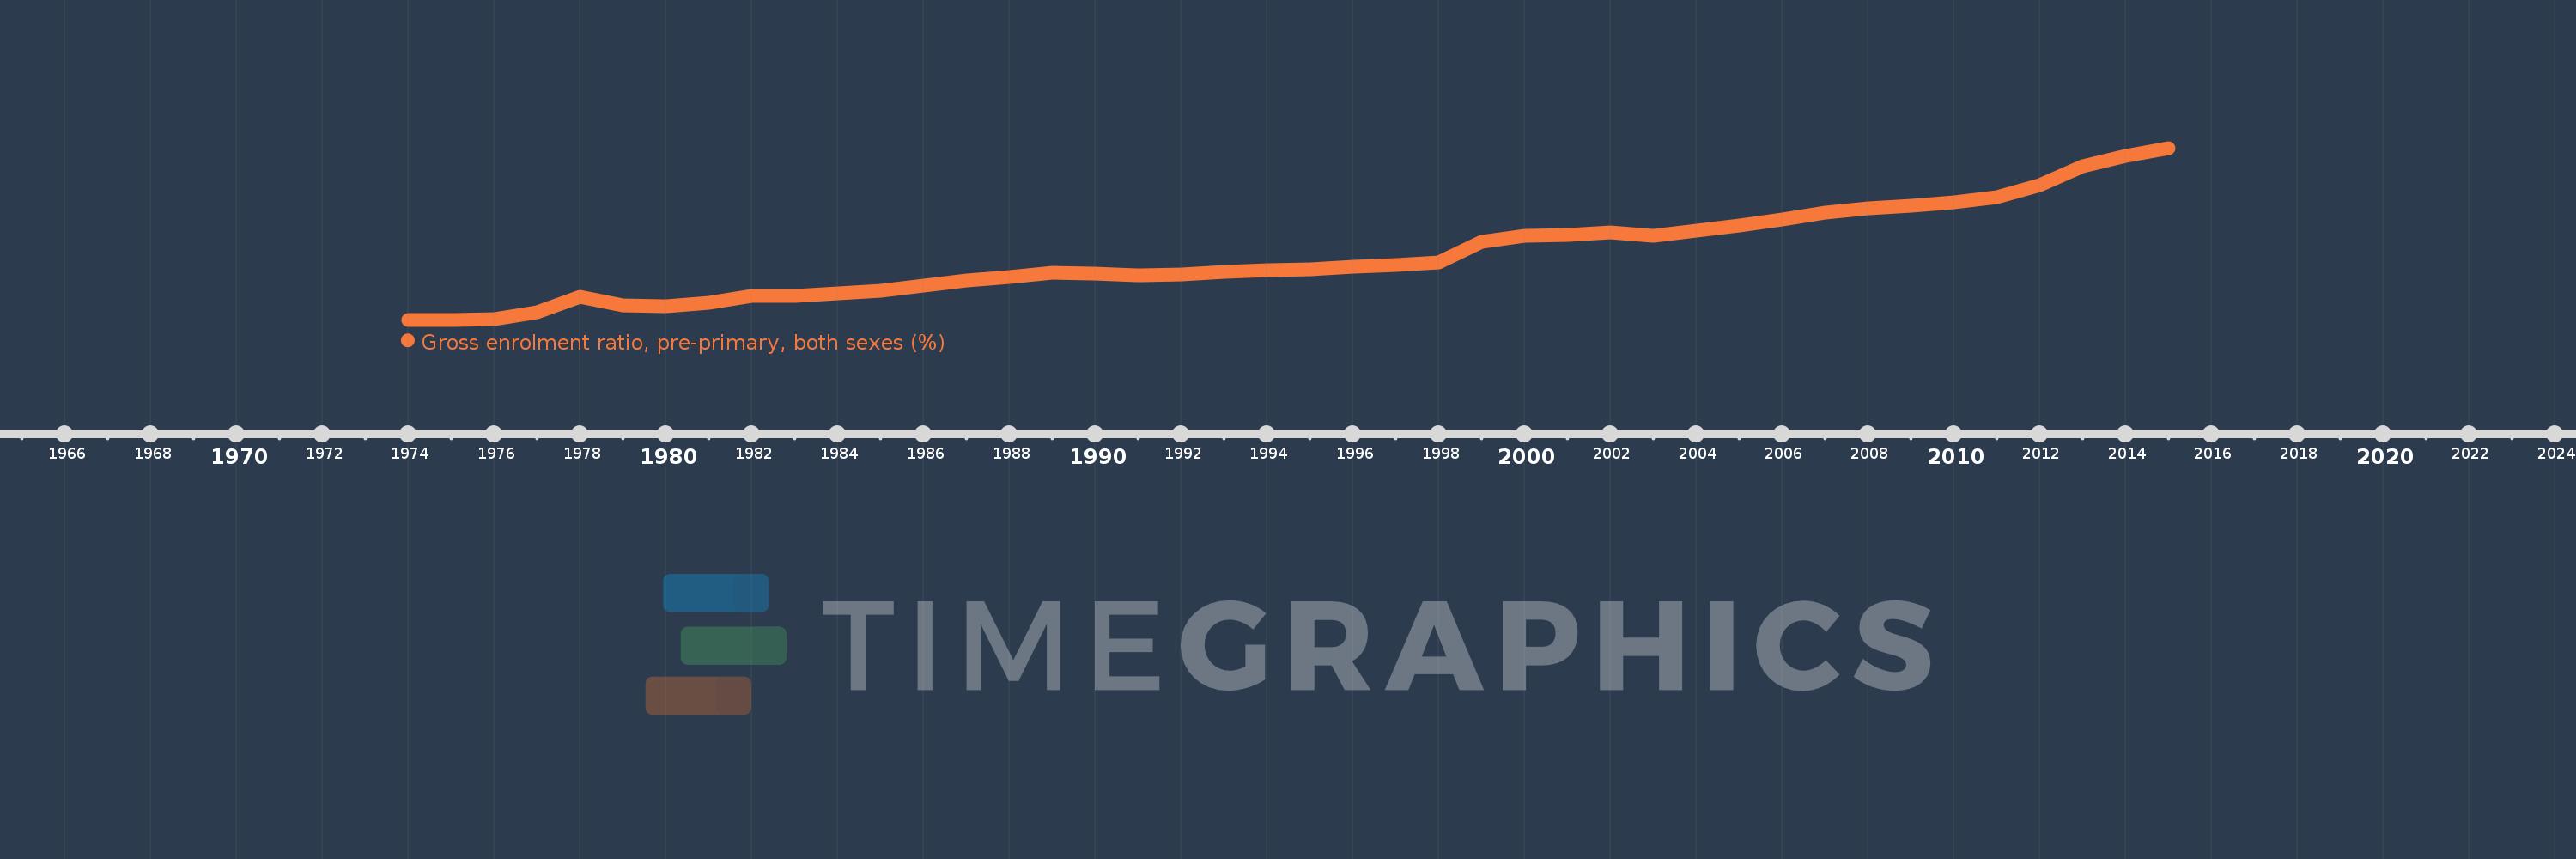
Gross enrolment ratio, pre-primary, both sexes (%)
2015,2014,2013,2012,2011,2010,2009,2008,2007,2006,2005,2004,2003,2002,2001,2000,1999,1998,1997,1996,1995,1994,1993,1992,1991,1990,1989,1988,1987,1986,1985,1984,1983,1982,1981,1980,1979,1978,1977,1976,1975,1974
This statistics in other country:
AfghanistanAlbaniaAlgeriaAndorraAngolaAntigua and BarbudaArab WorldArgentinaArmeniaArubaAustraliaAustriaAzerbaijanBahamas, TheBahrainBangladeshBarbadosBelarusBelgiumBelizeBeninBermudaBhutanBoliviaBosnia and HerzegovinaBotswanaBrazilBritish Virgin IslandsBrunei DarussalamBulgariaBurkina FasoBurundiCabo VerdeCambodiaCameroonCanadaCaribbean small statesCentral African RepublicCentral Europe and the BalticsChadChileChinaColombiaComorosCongo, Dem. Rep.Congo, Rep.Costa RicaCote d'IvoireCroatiaCubaCyprusCzech RepublicDenmarkDjiboutiDominicaDominican RepublicEarly-demographic dividendEast Asia & PacificEast Asia & Pacific (excluding high income)East Asia & Pacific (IDA & IBRD countries)EcuadorEgypt, Arab Rep.El SalvadorEquatorial GuineaEritreaEstoniaEthiopiaEuro areaEurope & Central AsiaEurope & Central Asia (excluding high income)Europe & Central Asia (IDA & IBRD countries)European UnionFijiFinlandFragile and conflict affected situationsFranceGabonGambia, TheGeorgiaGermanyGhanaGreeceGrenadaGuatemalaGuineaGuinea-BissauGuyanaHaitiHeavily indebted poor countries (HIPC)High incomeHondurasHong Kong SAR, ChinaHungaryIBRD onlyIcelandIDA & IBRD totalIDA blendIDA onlyIDA totalIndiaIndonesiaIran, Islamic Rep.IraqIrelandIsraelItalyJamaicaJapanJordanKazakhstanKenyaKiribatiKorea, Dem. People’s Rep.Korea, Rep.KuwaitKyrgyz RepublicLao PDRLate-demographic dividendLatin America & Caribbean Latin America & Caribbean (excluding high income)Latin America & the Caribbean (IDA & IBRD countries)LatviaLeast developed countries: UN classificationLebanonLesothoLiberiaLibyaLiechtensteinLithuaniaLow & middle incomeLow incomeLower middle incomeLuxembourgMacao SAR, ChinaMacedonia, FYRMadagascarMalaysiaMaldivesMaliMaltaMarshall IslandsMauritaniaMauritiusMexicoMicronesia, Fed. Sts.Middle East & North AfricaMiddle East & North Africa (excluding high income)Middle East & North Africa (IDA & IBRD countries)Middle incomeMoldovaMongoliaMontenegroMoroccoMozambiqueMyanmarNamibiaNauruNepalNetherlandsNew ZealandNicaraguaNigerNigeriaNorth AmericaNorwayOECD membersOmanOther small statesPacific island small statesPakistanPalauPanamaPapua New GuineaParaguayPeruPhilippinesPolandPortugalPost-demographic dividendPre-demographic dividendPuerto RicoQatarRomaniaRussian FederationRwandaSamoaSan MarinoSao Tome and PrincipeSaudi ArabiaSenegalSerbiaSeychellesSierra LeoneSlovak RepublicSloveniaSmall statesSolomon IslandsSomaliaSouth AfricaSouth AsiaSouth Asia (IDA & IBRD)South SudanSpainSri LankaSt. Kitts and NevisSt. LuciaSt. Vincent and the GrenadinesSub-Saharan Africa Sub-Saharan Africa (excluding high income)Sub-Saharan Africa (IDA & IBRD countries)SudanSurinameSwazilandSwedenSwitzerlandSyrian Arab RepublicTajikistanTanzaniaThailandTimor-LesteTogoTongaTrinidad and TobagoTunisiaTurkeyTurkmenistanTuvaluUgandaUkraineUnited Arab EmiratesUnited KingdomUnited StatesUpper middle incomeUruguayUzbekistanVanuatuVenezuela, RBVietnamWest Bank and GazaWorldYemen, Rep.ZambiaZimbabwe Timeline:
This timeline shows a graph from 1974 to 2015 of East Asia & Pacific (IDA & IBRD countries). No data until 1973. Number of actual observations by date: 42.
Source name:
World Development Indicators
Source organization:
UNESCO Institute for Statistics
Categories, topics:
Education
Last updated:
apr 23, 2017
Indicators value changes by year
Maximum:
74.835
jan 1, 2015
At the date of observation
Value
Absolute change
Change from previous value
jan 1, 1974
3.242
+3.242
0.0%
jan 1, 1975
3.223
-0.018
-0.56%
jan 1, 1976
3.483
+0.259
8.05%
jan 1, 1977
6.325
+2.843
81.62%
jan 1, 1978
12.622
+6.297
99.56%
jan 1, 1979
9.168
-3.454
-27.37%
jan 1, 1980
8.724
-0.444
-4.85%
jan 1, 1981
10.309
+1.585
18.17%
jan 1, 1982
13.25
+2.941
28.53%
jan 1, 1983
13.164
-0.085
-0.64%
jan 1, 1984
14.239
+1.075
8.17%
jan 1, 1985
15.371
+1.132
7.95%
jan 1, 1986
17.42
+2.049
13.33%
jan 1, 1987
19.69
+2.27
13.03%
jan 1, 1988
21.162
+1.472
7.48%
jan 1, 1989
22.744
+1.582
7.48%
jan 1, 1990
22.51
-0.234
-1.03%
jan 1, 1991
21.619
-0.891
-3.96%
jan 1, 1992
22.085
+0.467
2.16%
jan 1, 1993
23.019
+0.933
4.23%
jan 1, 1994
23.838
+0.819
3.56%
jan 1, 1995
24.321
+0.483
2.03%
jan 1, 1996
25.183
+0.862
3.54%
jan 1, 1997
26.062
+0.879
3.49%
jan 1, 1998
27.204
+1.142
4.38%
jan 1, 1999
35.845
+8.641
31.76%
jan 1, 2000
38.058
+2.213
6.17%
jan 1, 2001
38.68
+0.622
1.63%
jan 1, 2002
39.531
+0.851
2.2%
jan 1, 2003
38.383
-1.148
-2.9%
jan 1, 2004
40.472
+2.088
5.44%
jan 1, 2005
42.463
+1.991
4.92%
jan 1, 2006
44.914
+2.451
5.77%
jan 1, 2007
47.79
+2.876
6.4%
jan 1, 2008
49.773
+1.983
4.15%
jan 1, 2009
50.739
+0.966
1.94%
jan 1, 2010
52.17
+1.431
2.82%
jan 1, 2011
54.459
+2.289
4.39%
jan 1, 2012
59.415
+4.956
9.1%
jan 1, 2013
67.077
+7.662
12.9%
jan 1, 2014
71.506
+4.429
6.6%
jan 1, 2015
74.835
+3.328
4.65%
Ranking of countries by current statistics by years


Comments: