29
/
en
AIzaSyAYiBZKx7MnpbEhh9jyipgxe19OcubqV5w
April 1, 2024
52647
OECD members
OED
false
2
1
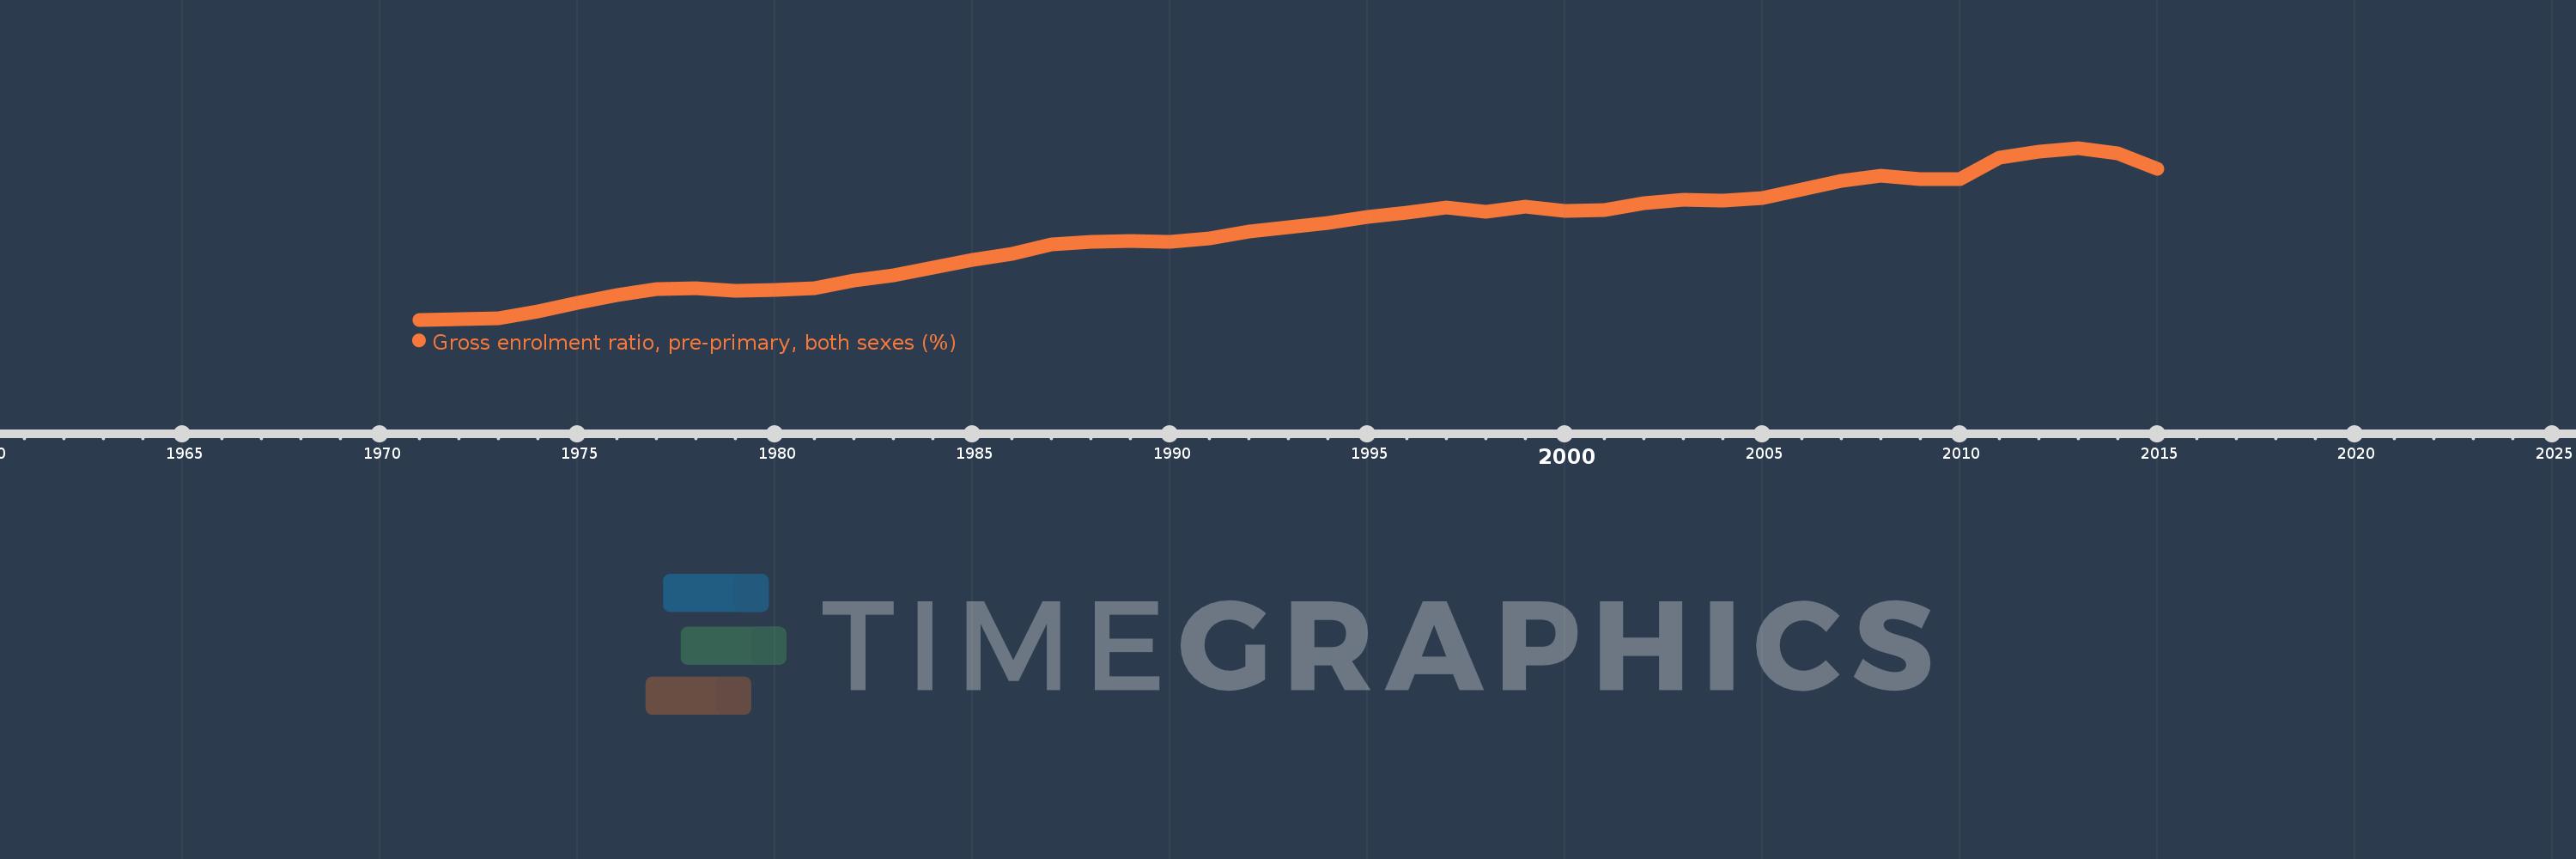
Gross enrolment ratio, pre-primary, both sexes (%)
2015,2014,2013,2012,2011,2010,2009,2008,2007,2006,2005,2004,2003,2002,2001,2000,1999,1998,1997,1996,1995,1994,1993,1992,1991,1990,1989,1988,1987,1986,1985,1984,1983,1982,1981,1980,1979,1978,1977,1976,1975,1974,1973,1972,1971
This statistics in other country:
AfghanistanAlbaniaAlgeriaAndorraAngolaAntigua and BarbudaArab WorldArgentinaArmeniaArubaAustraliaAustriaAzerbaijanBahamas, TheBahrainBangladeshBarbadosBelarusBelgiumBelizeBeninBermudaBhutanBoliviaBosnia and HerzegovinaBotswanaBrazilBritish Virgin IslandsBrunei DarussalamBulgariaBurkina FasoBurundiCabo VerdeCambodiaCameroonCanadaCaribbean small statesCentral African RepublicCentral Europe and the BalticsChadChileChinaColombiaComorosCongo, Dem. Rep.Congo, Rep.Costa RicaCote d'IvoireCroatiaCubaCyprusCzech RepublicDenmarkDjiboutiDominicaDominican RepublicEarly-demographic dividendEast Asia & PacificEast Asia & Pacific (excluding high income)East Asia & Pacific (IDA & IBRD countries)EcuadorEgypt, Arab Rep.El SalvadorEquatorial GuineaEritreaEstoniaEthiopiaEuro areaEurope & Central AsiaEurope & Central Asia (excluding high income)Europe & Central Asia (IDA & IBRD countries)European UnionFijiFinlandFragile and conflict affected situationsFranceGabonGambia, TheGeorgiaGermanyGhanaGreeceGrenadaGuatemalaGuineaGuinea-BissauGuyanaHaitiHeavily indebted poor countries (HIPC)High incomeHondurasHong Kong SAR, ChinaHungaryIBRD onlyIcelandIDA & IBRD totalIDA blendIDA onlyIDA totalIndiaIndonesiaIran, Islamic Rep.IraqIrelandIsraelItalyJamaicaJapanJordanKazakhstanKenyaKiribatiKorea, Dem. People’s Rep.Korea, Rep.KuwaitKyrgyz RepublicLao PDRLate-demographic dividendLatin America & Caribbean Latin America & Caribbean (excluding high income)Latin America & the Caribbean (IDA & IBRD countries)LatviaLeast developed countries: UN classificationLebanonLesothoLiberiaLibyaLiechtensteinLithuaniaLow & middle incomeLow incomeLower middle incomeLuxembourgMacao SAR, ChinaMacedonia, FYRMadagascarMalaysiaMaldivesMaliMaltaMarshall IslandsMauritaniaMauritiusMexicoMicronesia, Fed. Sts.Middle East & North AfricaMiddle East & North Africa (excluding high income)Middle East & North Africa (IDA & IBRD countries)Middle incomeMoldovaMongoliaMontenegroMoroccoMozambiqueMyanmarNamibiaNauruNepalNetherlandsNew ZealandNicaraguaNigerNigeriaNorth AmericaNorwayOECD membersOmanOther small statesPacific island small statesPakistanPalauPanamaPapua New GuineaParaguayPeruPhilippinesPolandPortugalPost-demographic dividendPre-demographic dividendPuerto RicoQatarRomaniaRussian FederationRwandaSamoaSan MarinoSao Tome and PrincipeSaudi ArabiaSenegalSerbiaSeychellesSierra LeoneSlovak RepublicSloveniaSmall statesSolomon IslandsSomaliaSouth AfricaSouth AsiaSouth Asia (IDA & IBRD)South SudanSpainSri LankaSt. Kitts and NevisSt. LuciaSt. Vincent and the GrenadinesSub-Saharan Africa Sub-Saharan Africa (excluding high income)Sub-Saharan Africa (IDA & IBRD countries)SudanSurinameSwazilandSwedenSwitzerlandSyrian Arab RepublicTajikistanTanzaniaThailandTimor-LesteTogoTongaTrinidad and TobagoTunisiaTurkeyTurkmenistanTuvaluUgandaUkraineUnited Arab EmiratesUnited KingdomUnited StatesUpper middle incomeUruguayUzbekistanVanuatuVenezuela, RBVietnamWest Bank and GazaWorldYemen, Rep.ZambiaZimbabwe Timeline:
This timeline shows a graph from 1971 to 2015 of OECD members. No data until 1970. Number of actual observations by date: 45.
Source name:
World Development Indicators
Source organization:
UNESCO Institute for Statistics
Categories, topics:
Education
Last updated:
apr 23, 2017
Indicators value changes by year
Minimum:
42.861
jan 1, 1971
At the date of observation
Value
Absolute change
Change from previous value
jan 1, 1971
42.861
+42.861
0.0%
jan 1, 1972
42.935
+0.075
0.17%
jan 1, 1973
43.235
+0.3
0.7%
jan 1, 1974
44.835
+1.599
3.7%
jan 1, 1975
46.882
+2.048
4.57%
jan 1, 1976
48.761
+1.879
4.01%
jan 1, 1977
50.364
+1.603
3.29%
jan 1, 1978
50.428
+0.064
0.13%
jan 1, 1979
49.854
-0.573
-1.14%
jan 1, 1980
49.973
+0.118
0.24%
jan 1, 1981
50.55
+0.577
1.16%
jan 1, 1982
52.248
+1.698
3.36%
jan 1, 1983
53.556
+1.308
2.5%
jan 1, 1984
55.418
+1.862
3.48%
jan 1, 1985
57.307
+1.889
3.41%
jan 1, 1986
58.823
+1.516
2.65%
jan 1, 1987
61.0
+2.177
3.7%
jan 1, 1988
61.688
+0.689
1.13%
jan 1, 1989
61.883
+0.195
0.32%
jan 1, 1990
61.773
-0.11
-0.18%
jan 1, 1991
62.571
+0.798
1.29%
jan 1, 1992
64.247
+1.676
2.68%
jan 1, 1993
65.135
+0.889
1.38%
jan 1, 1994
66.294
+1.159
1.78%
jan 1, 1995
67.695
+1.401
2.11%
jan 1, 1996
68.7
+1.005
1.48%
jan 1, 1997
70.063
+1.364
1.98%
jan 1, 1998
68.883
-1.18
-1.68%
jan 1, 1999
70.256
+1.373
1.99%
jan 1, 2000
69.06
-1.195
-1.7%
jan 1, 2001
69.302
+0.241
0.35%
jan 1, 2002
71.099
+1.798
2.59%
jan 1, 2003
71.782
+0.683
0.96%
jan 1, 2004
71.629
-0.153
-0.21%
jan 1, 2005
72.284
+0.655
0.91%
jan 1, 2006
74.396
+2.112
2.92%
jan 1, 2007
76.333
+1.937
2.6%
jan 1, 2008
77.554
+1.221
1.6%
jan 1, 2009
76.906
-0.648
-0.84%
jan 1, 2010
76.877
-0.029
-0.04%
jan 1, 2011
81.987
+5.11
6.65%
jan 1, 2012
83.465
+1.478
1.8%
jan 1, 2013
84.35
+0.885
1.06%
jan 1, 2014
83.027
-1.323
-1.57%
jan 1, 2015
79.322
-3.705
-4.46%
Ranking of countries by current statistics by years


Comments: