29
/
en
AIzaSyAYiBZKx7MnpbEhh9jyipgxe19OcubqV5w
April 1, 2024
157338
Iran, Islamic Rep.
IRN
true
2
1
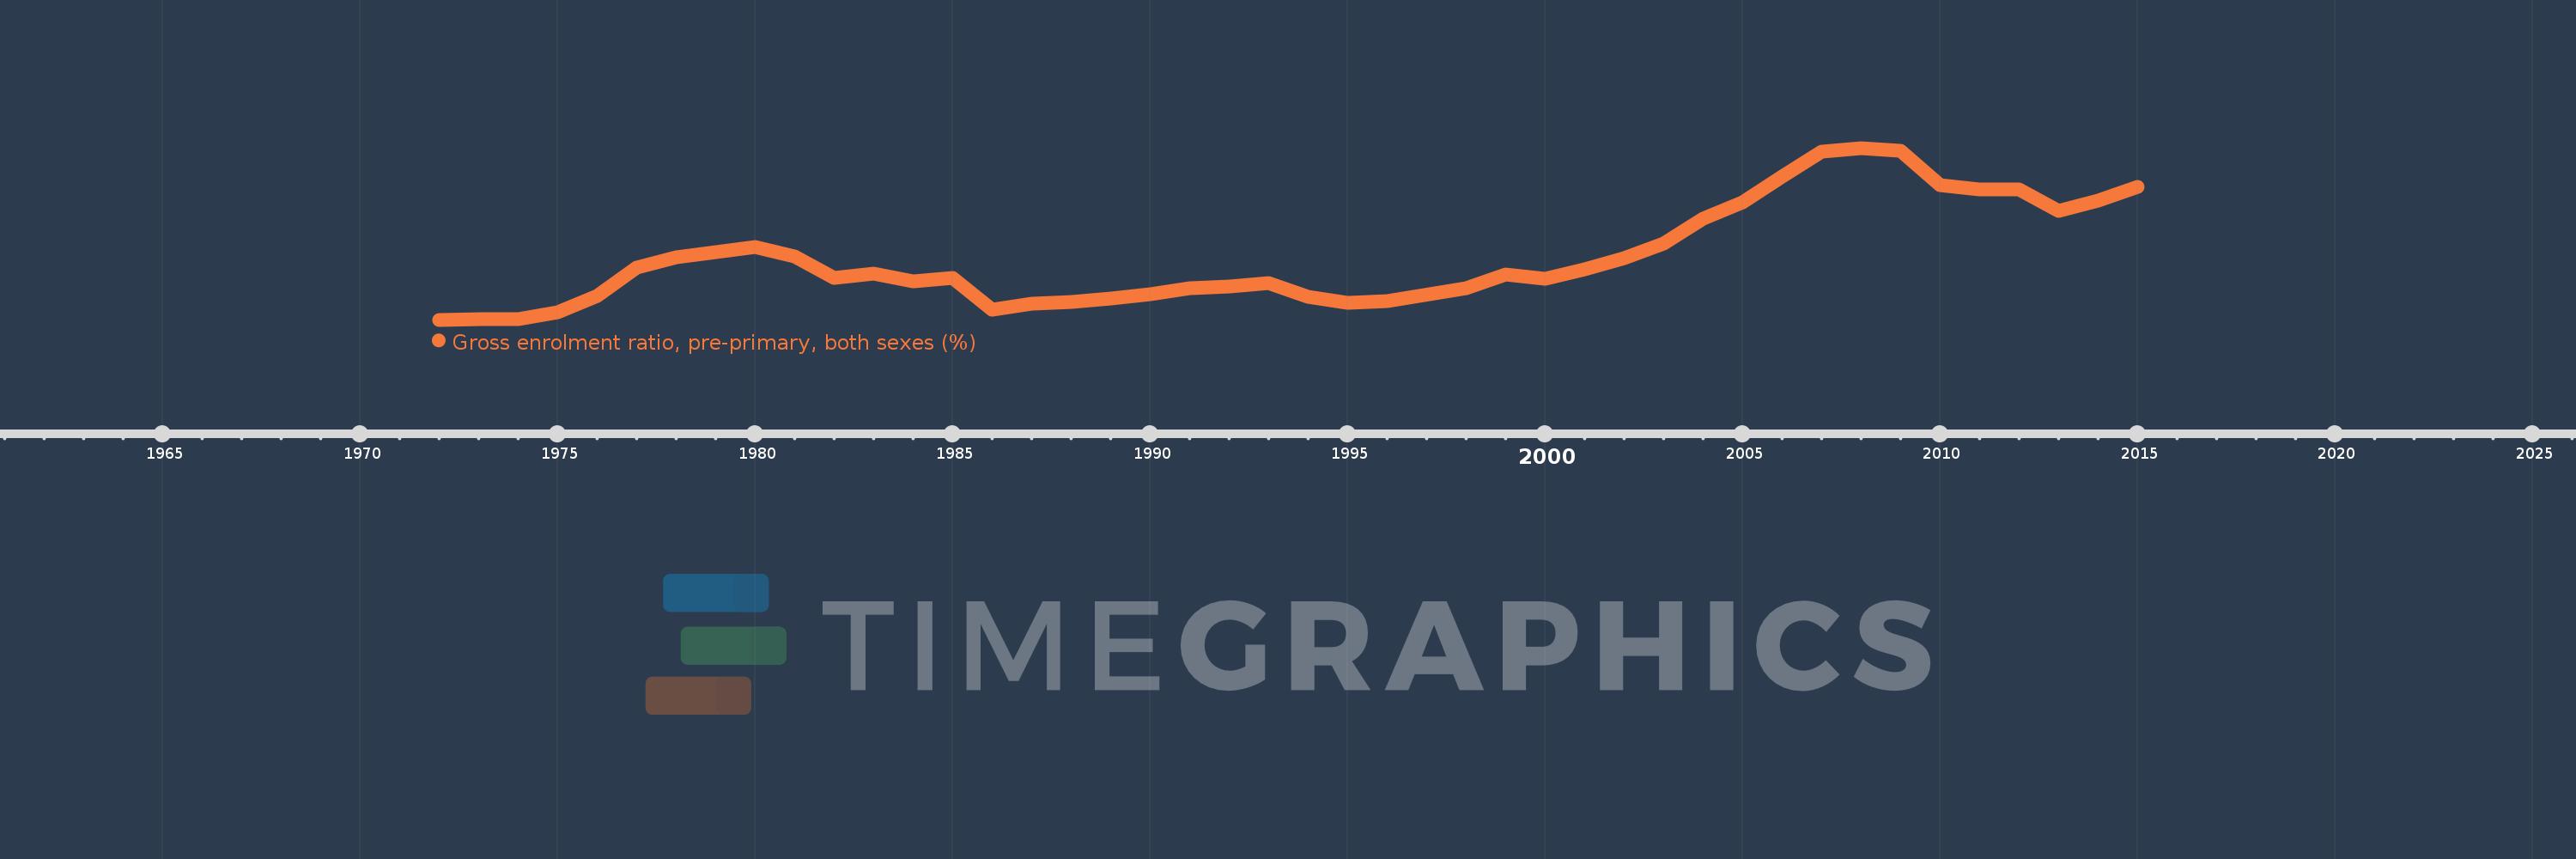
Gross enrolment ratio, pre-primary, both sexes (%)
2015,2014,2013,2012,2011,2010,2009,2008,2007,2006,2005,2004,2003,2002,2001,2000,1999,1998,1996,1995,1994,1993,1992,1991,1990,1989,1988,1987,1986,1985,1984,1983,1982,1981,1980,1979,1978,1977,1976,1975,1974,1973,1972
This statistics in other country:
AfghanistanAlbaniaAlgeriaAndorraAngolaAntigua and BarbudaArab WorldArgentinaArmeniaArubaAustraliaAustriaAzerbaijanBahamas, TheBahrainBangladeshBarbadosBelarusBelgiumBelizeBeninBermudaBhutanBoliviaBosnia and HerzegovinaBotswanaBrazilBritish Virgin IslandsBrunei DarussalamBulgariaBurkina FasoBurundiCabo VerdeCambodiaCameroonCanadaCaribbean small statesCentral African RepublicCentral Europe and the BalticsChadChileChinaColombiaComorosCongo, Dem. Rep.Congo, Rep.Costa RicaCote d'IvoireCroatiaCubaCyprusCzech RepublicDenmarkDjiboutiDominicaDominican RepublicEarly-demographic dividendEast Asia & PacificEast Asia & Pacific (excluding high income)East Asia & Pacific (IDA & IBRD countries)EcuadorEgypt, Arab Rep.El SalvadorEquatorial GuineaEritreaEstoniaEthiopiaEuro areaEurope & Central AsiaEurope & Central Asia (excluding high income)Europe & Central Asia (IDA & IBRD countries)European UnionFijiFinlandFragile and conflict affected situationsFranceGabonGambia, TheGeorgiaGermanyGhanaGreeceGrenadaGuatemalaGuineaGuinea-BissauGuyanaHaitiHeavily indebted poor countries (HIPC)High incomeHondurasHong Kong SAR, ChinaHungaryIBRD onlyIcelandIDA & IBRD totalIDA blendIDA onlyIDA totalIndiaIndonesiaIran, Islamic Rep.IraqIrelandIsraelItalyJamaicaJapanJordanKazakhstanKenyaKiribatiKorea, Dem. People’s Rep.Korea, Rep.KuwaitKyrgyz RepublicLao PDRLate-demographic dividendLatin America & Caribbean Latin America & Caribbean (excluding high income)Latin America & the Caribbean (IDA & IBRD countries)LatviaLeast developed countries: UN classificationLebanonLesothoLiberiaLibyaLiechtensteinLithuaniaLow & middle incomeLow incomeLower middle incomeLuxembourgMacao SAR, ChinaMacedonia, FYRMadagascarMalaysiaMaldivesMaliMaltaMarshall IslandsMauritaniaMauritiusMexicoMicronesia, Fed. Sts.Middle East & North AfricaMiddle East & North Africa (excluding high income)Middle East & North Africa (IDA & IBRD countries)Middle incomeMoldovaMongoliaMontenegroMoroccoMozambiqueMyanmarNamibiaNauruNepalNetherlandsNew ZealandNicaraguaNigerNigeriaNorth AmericaNorwayOECD membersOmanOther small statesPacific island small statesPakistanPalauPanamaPapua New GuineaParaguayPeruPhilippinesPolandPortugalPost-demographic dividendPre-demographic dividendPuerto RicoQatarRomaniaRussian FederationRwandaSamoaSan MarinoSao Tome and PrincipeSaudi ArabiaSenegalSerbiaSeychellesSierra LeoneSlovak RepublicSloveniaSmall statesSolomon IslandsSomaliaSouth AfricaSouth AsiaSouth Asia (IDA & IBRD)South SudanSpainSri LankaSt. Kitts and NevisSt. LuciaSt. Vincent and the GrenadinesSub-Saharan Africa Sub-Saharan Africa (excluding high income)Sub-Saharan Africa (IDA & IBRD countries)SudanSurinameSwazilandSwedenSwitzerlandSyrian Arab RepublicTajikistanTanzaniaThailandTimor-LesteTogoTongaTrinidad and TobagoTunisiaTurkeyTurkmenistanTuvaluUgandaUkraineUnited Arab EmiratesUnited KingdomUnited StatesUpper middle incomeUruguayUzbekistanVanuatuVenezuela, RBVietnamWest Bank and GazaWorldYemen, Rep.ZambiaZimbabwe Timeline:
This timeline shows a graph from 1972 to 2015 of Iran, Islamic Rep.. No data until 1971. Number of actual observations by date: 43.
Source name:
World Development Indicators
Source organization:
UNESCO Institute for Statistics
Categories, topics:
Education
Last updated:
apr 23, 2017
Indicators value changes by year
Maximum:
54.024
jan 1, 2008
At the date of observation
Value
Absolute change
Change from previous value
jan 1, 1972
2.202
+2.202
0.0%
jan 1, 1973
2.366
+0.164
7.45%
jan 1, 1974
2.372
+0.005
0.22%
jan 1, 1975
4.367
+1.995
84.13%
jan 1, 1976
9.263
+4.896
112.11%
jan 1, 1977
17.892
+8.629
93.16%
jan 1, 1978
21.017
+3.125
17.47%
jan 1, 1979
22.658
+1.641
7.81%
jan 1, 1980
24.176
+1.518
6.7%
jan 1, 1981
21.246
-2.93
-12.12%
jan 1, 1982
14.851
-6.395
-30.1%
jan 1, 1983
15.987
+1.136
7.65%
jan 1, 1984
13.687
-2.3
-14.39%
jan 1, 1985
14.748
+1.061
7.75%
jan 1, 1986
5.338
-9.41
-63.81%
jan 1, 1987
6.953
+1.615
30.26%
jan 1, 1988
7.578
+0.624
8.98%
jan 1, 1989
8.52
+0.942
12.44%
jan 1, 1990
9.905
+1.385
16.26%
jan 1, 1991
11.747
+1.842
18.6%
jan 1, 1992
12.164
+0.417
3.55%
jan 1, 1993
13.388
+1.223
10.06%
jan 1, 1994
8.999
-4.388
-32.78%
jan 1, 1995
7.189
-1.81
-20.11%
jan 1, 1996
7.88
+0.69
9.6%
jan 1, 1998
11.649
+3.769
47.83%
jan 1, 1999
15.787
+4.138
35.53%
jan 1, 2000
14.499
-1.288
-8.16%
jan 1, 2001
17.396
+2.897
19.98%
jan 1, 2002
20.674
+3.278
18.84%
jan 1, 2003
25.17
+4.496
21.75%
jan 1, 2004
32.778
+7.609
30.23%
jan 1, 2005
37.572
+4.793
14.62%
jan 1, 2006
45.451
+7.88
20.97%
jan 1, 2007
52.79
+7.339
16.15%
jan 1, 2008
54.024
+1.234
2.34%
jan 1, 2009
53.052
-0.972
-1.8%
jan 1, 2010
42.885
-10.167
-19.16%
jan 1, 2011
41.485
-1.4
-3.26%
jan 1, 2012
41.497
+0.012
0.03%
jan 1, 2013
35.074
-6.423
-15.48%
jan 1, 2014
38.125
+3.051
8.7%
jan 1, 2015
42.397
+4.272
11.21%
Ranking of countries by current statistics by years


Comments: