29
/
en
AIzaSyAYiBZKx7MnpbEhh9jyipgxe19OcubqV5w
April 1, 2024
257359
Switzerland
CHE
true
2
1
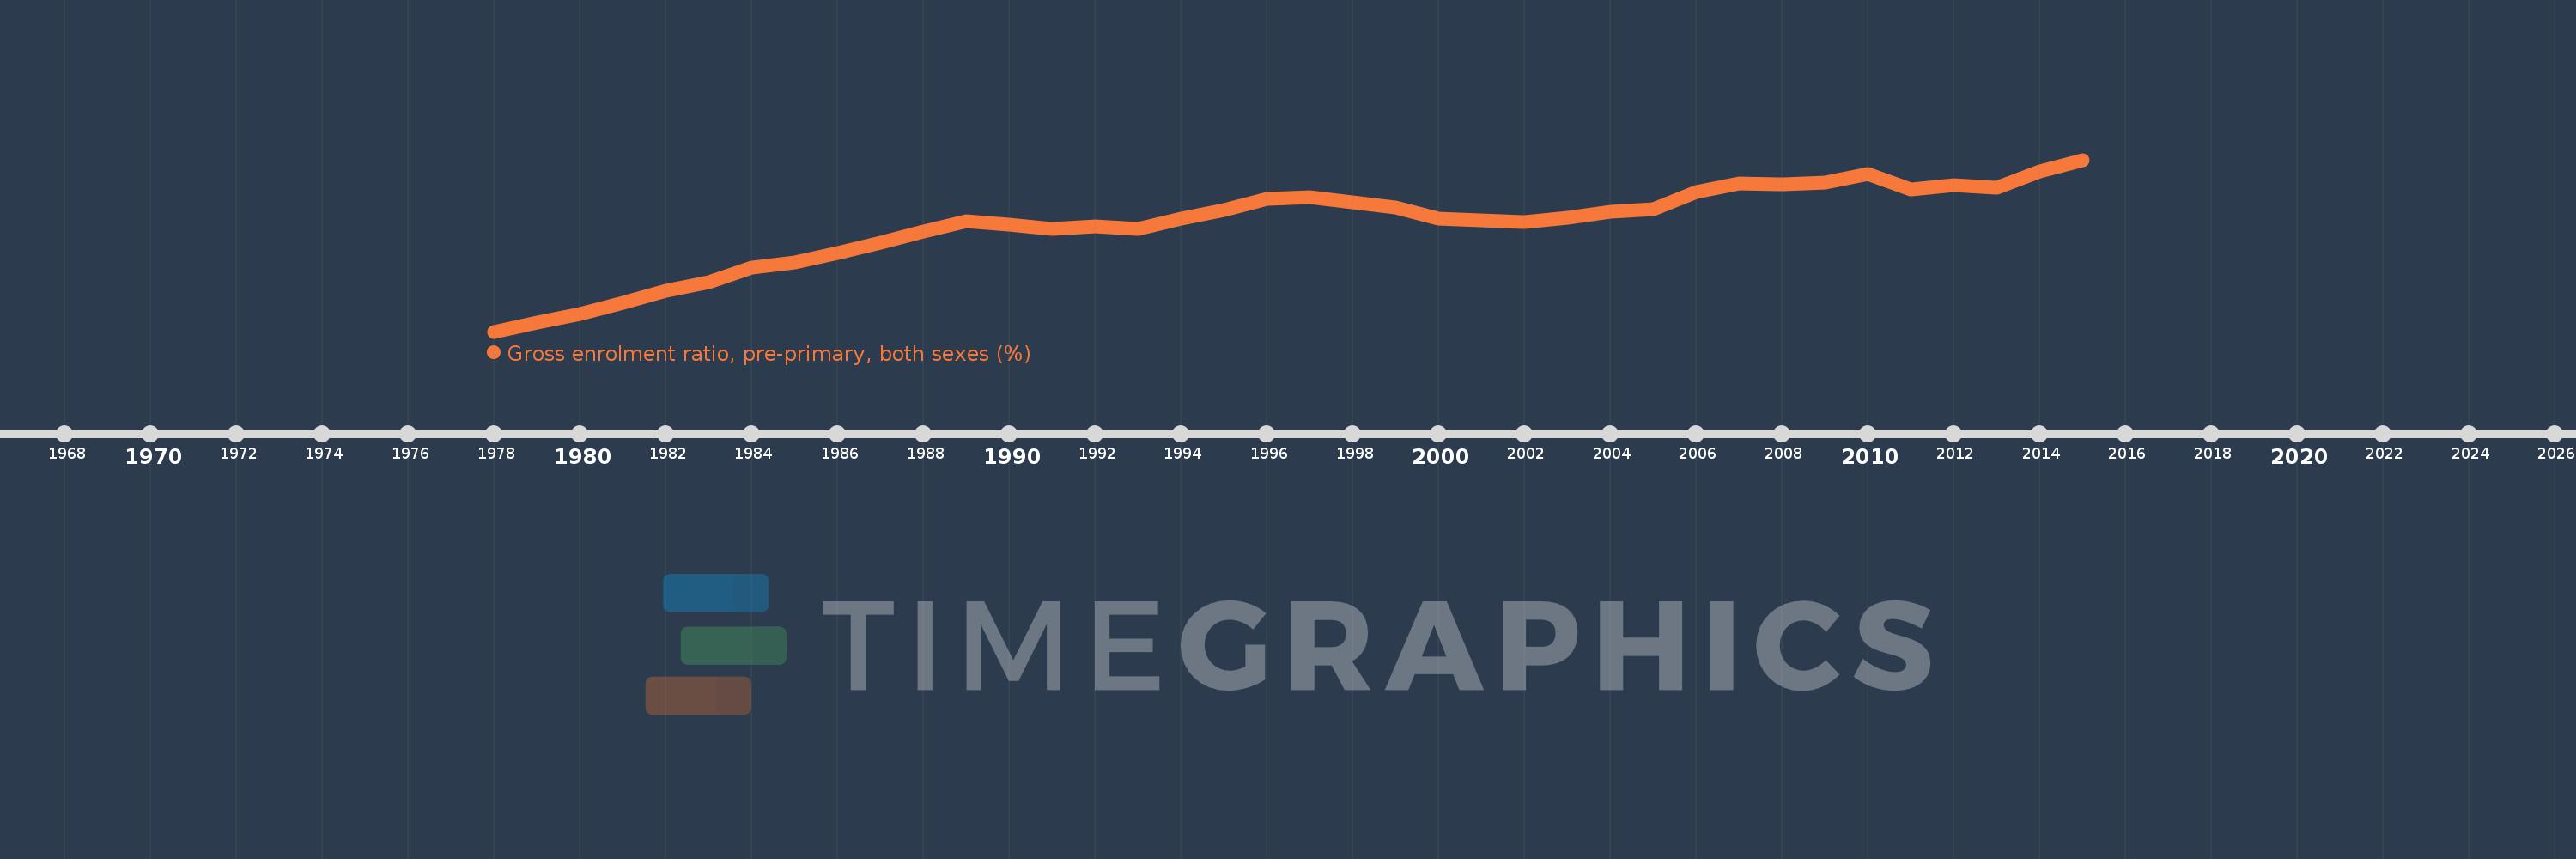
Gross enrolment ratio, pre-primary, both sexes (%)
2015,2014,2013,2012,2011,2010,2009,2008,2007,2006,2005,2004,2003,2002,2001,2000,1999,1997,1996,1995,1994,1993,1992,1991,1990,1989,1988,1987,1986,1985,1984,1983,1982,1981,1980,1979,1978
This statistics in other country:
AfghanistanAlbaniaAlgeriaAndorraAngolaAntigua and BarbudaArab WorldArgentinaArmeniaArubaAustraliaAustriaAzerbaijanBahamas, TheBahrainBangladeshBarbadosBelarusBelgiumBelizeBeninBermudaBhutanBoliviaBosnia and HerzegovinaBotswanaBrazilBritish Virgin IslandsBrunei DarussalamBulgariaBurkina FasoBurundiCabo VerdeCambodiaCameroonCanadaCaribbean small statesCentral African RepublicCentral Europe and the BalticsChadChileChinaColombiaComorosCongo, Dem. Rep.Congo, Rep.Costa RicaCote d'IvoireCroatiaCubaCyprusCzech RepublicDenmarkDjiboutiDominicaDominican RepublicEarly-demographic dividendEast Asia & PacificEast Asia & Pacific (excluding high income)East Asia & Pacific (IDA & IBRD countries)EcuadorEgypt, Arab Rep.El SalvadorEquatorial GuineaEritreaEstoniaEthiopiaEuro areaEurope & Central AsiaEurope & Central Asia (excluding high income)Europe & Central Asia (IDA & IBRD countries)European UnionFijiFinlandFragile and conflict affected situationsFranceGabonGambia, TheGeorgiaGermanyGhanaGreeceGrenadaGuatemalaGuineaGuinea-BissauGuyanaHaitiHeavily indebted poor countries (HIPC)High incomeHondurasHong Kong SAR, ChinaHungaryIBRD onlyIcelandIDA & IBRD totalIDA blendIDA onlyIDA totalIndiaIndonesiaIran, Islamic Rep.IraqIrelandIsraelItalyJamaicaJapanJordanKazakhstanKenyaKiribatiKorea, Dem. People’s Rep.Korea, Rep.KuwaitKyrgyz RepublicLao PDRLate-demographic dividendLatin America & Caribbean Latin America & Caribbean (excluding high income)Latin America & the Caribbean (IDA & IBRD countries)LatviaLeast developed countries: UN classificationLebanonLesothoLiberiaLibyaLiechtensteinLithuaniaLow & middle incomeLow incomeLower middle incomeLuxembourgMacao SAR, ChinaMacedonia, FYRMadagascarMalaysiaMaldivesMaliMaltaMarshall IslandsMauritaniaMauritiusMexicoMicronesia, Fed. Sts.Middle East & North AfricaMiddle East & North Africa (excluding high income)Middle East & North Africa (IDA & IBRD countries)Middle incomeMoldovaMongoliaMontenegroMoroccoMozambiqueMyanmarNamibiaNauruNepalNetherlandsNew ZealandNicaraguaNigerNigeriaNorth AmericaNorwayOECD membersOmanOther small statesPacific island small statesPakistanPalauPanamaPapua New GuineaParaguayPeruPhilippinesPolandPortugalPost-demographic dividendPre-demographic dividendPuerto RicoQatarRomaniaRussian FederationRwandaSamoaSan MarinoSao Tome and PrincipeSaudi ArabiaSenegalSerbiaSeychellesSierra LeoneSlovak RepublicSloveniaSmall statesSolomon IslandsSomaliaSouth AfricaSouth AsiaSouth Asia (IDA & IBRD)South SudanSpainSri LankaSt. Kitts and NevisSt. LuciaSt. Vincent and the GrenadinesSub-Saharan Africa Sub-Saharan Africa (excluding high income)Sub-Saharan Africa (IDA & IBRD countries)SudanSurinameSwazilandSwedenSwitzerlandSyrian Arab RepublicTajikistanTanzaniaThailandTimor-LesteTogoTongaTrinidad and TobagoTunisiaTurkeyTurkmenistanTuvaluUgandaUkraineUnited Arab EmiratesUnited KingdomUnited StatesUpper middle incomeUruguayUzbekistanVanuatuVenezuela, RBVietnamWest Bank and GazaWorldYemen, Rep.ZambiaZimbabwe Timeline:
This timeline shows a graph from 1978 to 2015 of Switzerland. No data until 1977. Number of actual observations by date: 37.
Source name:
World Development Indicators
Source organization:
UNESCO Institute for Statistics
Categories, topics:
Education
Last updated:
apr 23, 2017
Indicators value changes by year
Minimum:
68.151
jan 1, 1978
Maximum:
105.105
jan 1, 2015
At the date of observation
Value
Absolute change
Change from previous value
jan 1, 1978
68.151
+68.151
0.0%
jan 1, 1979
70.021
+1.87
2.74%
jan 1, 1980
72.031
+2.01
2.87%
jan 1, 1981
74.403
+2.372
3.29%
jan 1, 1982
76.988
+2.586
3.48%
jan 1, 1983
78.762
+1.774
2.3%
jan 1, 1984
81.877
+3.114
3.95%
jan 1, 1985
82.947
+1.07
1.31%
jan 1, 1986
85.01
+2.063
2.49%
jan 1, 1987
87.239
+2.229
2.62%
jan 1, 1988
89.701
+2.463
2.82%
jan 1, 1989
91.909
+2.207
2.46%
jan 1, 1990
91.073
-0.835
-0.91%
jan 1, 1991
90.283
-0.791
-0.87%
jan 1, 1992
90.708
+0.425
0.47%
jan 1, 1993
90.15
-0.558
-0.61%
jan 1, 1994
92.51
+2.36
2.62%
jan 1, 1995
94.323
+1.813
1.96%
jan 1, 1996
96.623
+2.299
2.44%
jan 1, 1997
97.126
+0.503
0.52%
jan 1, 1999
94.773
-2.353
-2.42%
jan 1, 2000
92.395
-2.378
-2.51%
jan 1, 2001
92.169
-0.226
-0.24%
jan 1, 2002
91.673
-0.497
-0.54%
jan 1, 2003
92.633
+0.961
1.05%
jan 1, 2004
93.845
+1.212
1.31%
jan 1, 2005
94.516
+0.671
0.71%
jan 1, 2006
98.125
+3.609
3.82%
jan 1, 2007
100.033
+1.908
1.94%
jan 1, 2008
99.768
-0.266
-0.27%
jan 1, 2009
100.18
+0.413
0.41%
jan 1, 2010
102.043
+1.862
1.86%
jan 1, 2011
98.774
-3.269
-3.2%
jan 1, 2012
99.645
+0.871
0.88%
jan 1, 2013
99.153
-0.492
-0.49%
jan 1, 2014
102.523
+3.37
3.4%
jan 1, 2015
105.105
+2.582
2.52%
Ranking of countries by current statistics by years


Comments: