29
/
en
AIzaSyAYiBZKx7MnpbEhh9jyipgxe19OcubqV5w
April 1, 2024
106035
China
CHN
true
2
1
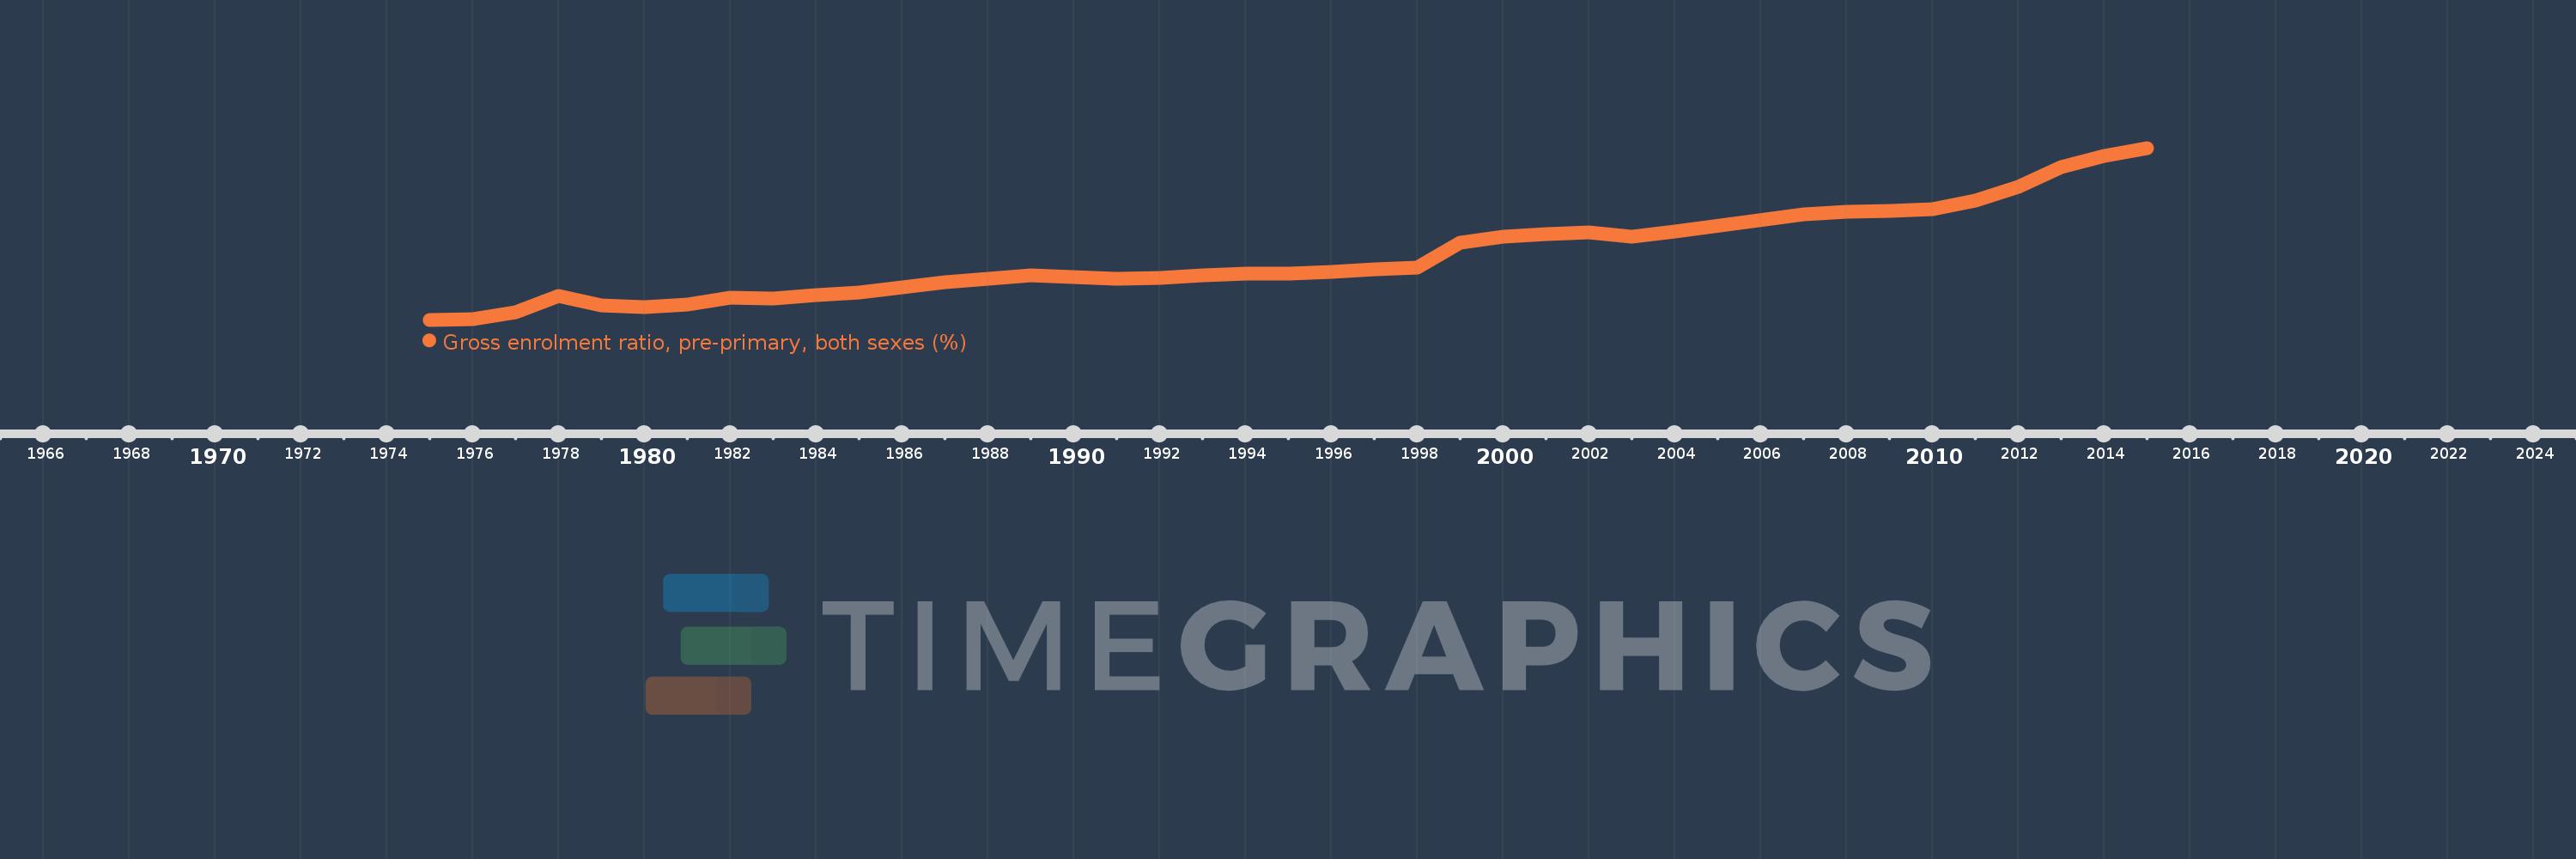
Gross enrolment ratio, pre-primary, both sexes (%)
2015,2014,2013,2012,2011,2010,2009,2008,2007,2004,2003,2002,2001,2000,1999,1998,1997,1996,1995,1994,1993,1992,1991,1990,1989,1988,1987,1986,1985,1984,1983,1982,1981,1980,1979,1978,1977,1976,1975
This statistics in other country:
AfghanistanAlbaniaAlgeriaAndorraAngolaAntigua and BarbudaArab WorldArgentinaArmeniaArubaAustraliaAustriaAzerbaijanBahamas, TheBahrainBangladeshBarbadosBelarusBelgiumBelizeBeninBermudaBhutanBoliviaBosnia and HerzegovinaBotswanaBrazilBritish Virgin IslandsBrunei DarussalamBulgariaBurkina FasoBurundiCabo VerdeCambodiaCameroonCanadaCaribbean small statesCentral African RepublicCentral Europe and the BalticsChadChileChinaColombiaComorosCongo, Dem. Rep.Congo, Rep.Costa RicaCote d'IvoireCroatiaCubaCyprusCzech RepublicDenmarkDjiboutiDominicaDominican RepublicEarly-demographic dividendEast Asia & PacificEast Asia & Pacific (excluding high income)East Asia & Pacific (IDA & IBRD countries)EcuadorEgypt, Arab Rep.El SalvadorEquatorial GuineaEritreaEstoniaEthiopiaEuro areaEurope & Central AsiaEurope & Central Asia (excluding high income)Europe & Central Asia (IDA & IBRD countries)European UnionFijiFinlandFragile and conflict affected situationsFranceGabonGambia, TheGeorgiaGermanyGhanaGreeceGrenadaGuatemalaGuineaGuinea-BissauGuyanaHaitiHeavily indebted poor countries (HIPC)High incomeHondurasHong Kong SAR, ChinaHungaryIBRD onlyIcelandIDA & IBRD totalIDA blendIDA onlyIDA totalIndiaIndonesiaIran, Islamic Rep.IraqIrelandIsraelItalyJamaicaJapanJordanKazakhstanKenyaKiribatiKorea, Dem. People’s Rep.Korea, Rep.KuwaitKyrgyz RepublicLao PDRLate-demographic dividendLatin America & Caribbean Latin America & Caribbean (excluding high income)Latin America & the Caribbean (IDA & IBRD countries)LatviaLeast developed countries: UN classificationLebanonLesothoLiberiaLibyaLiechtensteinLithuaniaLow & middle incomeLow incomeLower middle incomeLuxembourgMacao SAR, ChinaMacedonia, FYRMadagascarMalaysiaMaldivesMaliMaltaMarshall IslandsMauritaniaMauritiusMexicoMicronesia, Fed. Sts.Middle East & North AfricaMiddle East & North Africa (excluding high income)Middle East & North Africa (IDA & IBRD countries)Middle incomeMoldovaMongoliaMontenegroMoroccoMozambiqueMyanmarNamibiaNauruNepalNetherlandsNew ZealandNicaraguaNigerNigeriaNorth AmericaNorwayOECD membersOmanOther small statesPacific island small statesPakistanPalauPanamaPapua New GuineaParaguayPeruPhilippinesPolandPortugalPost-demographic dividendPre-demographic dividendPuerto RicoQatarRomaniaRussian FederationRwandaSamoaSan MarinoSao Tome and PrincipeSaudi ArabiaSenegalSerbiaSeychellesSierra LeoneSlovak RepublicSloveniaSmall statesSolomon IslandsSomaliaSouth AfricaSouth AsiaSouth Asia (IDA & IBRD)South SudanSpainSri LankaSt. Kitts and NevisSt. LuciaSt. Vincent and the GrenadinesSub-Saharan Africa Sub-Saharan Africa (excluding high income)Sub-Saharan Africa (IDA & IBRD countries)SudanSurinameSwazilandSwedenSwitzerlandSyrian Arab RepublicTajikistanTanzaniaThailandTimor-LesteTogoTongaTrinidad and TobagoTunisiaTurkeyTurkmenistanTuvaluUgandaUkraineUnited Arab EmiratesUnited KingdomUnited StatesUpper middle incomeUruguayUzbekistanVanuatuVenezuela, RBVietnamWest Bank and GazaWorldYemen, Rep.ZambiaZimbabwe Timeline:
This timeline shows a graph from 1975 to 2015 of China. No data until 1974. Number of actual observations by date: 39.
Source name:
World Development Indicators
Source organization:
UNESCO Institute for Statistics
Categories, topics:
Education
Last updated:
apr 23, 2017
Indicators value changes by year
Maximum:
81.611
jan 1, 2015
At the date of observation
Value
Absolute change
Change from previous value
jan 1, 1975
2.285
+2.285
0.0%
jan 1, 1976
2.44
+0.155
6.8%
jan 1, 1977
5.75
+3.31
135.64%
jan 1, 1978
13.16
+7.41
128.87%
jan 1, 1979
8.723
-4.437
-33.72%
jan 1, 1980
7.978
-0.745
-8.54%
jan 1, 1981
9.253
+1.275
15.98%
jan 1, 1982
12.616
+3.363
36.34%
jan 1, 1983
12.204
-0.412
-3.27%
jan 1, 1984
13.639
+1.435
11.76%
jan 1, 1985
14.751
+1.112
8.15%
jan 1, 1986
17.186
+2.435
16.51%
jan 1, 1987
19.807
+2.621
15.25%
jan 1, 1988
21.354
+1.547
7.81%
jan 1, 1989
22.751
+1.397
6.54%
jan 1, 1990
22.189
-0.561
-2.47%
jan 1, 1991
21.151
-1.039
-4.68%
jan 1, 1992
21.659
+0.508
2.4%
jan 1, 1993
22.831
+1.172
5.41%
jan 1, 1994
23.596
+0.765
3.35%
jan 1, 1995
23.658
+0.063
0.27%
jan 1, 1996
24.383
+0.724
3.06%
jan 1, 1997
25.538
+1.155
4.74%
jan 1, 1998
26.535
+0.997
3.9%
jan 1, 1999
38.021
+11.486
43.29%
jan 1, 2000
40.813
+2.793
7.35%
jan 1, 2001
41.747
+0.933
2.29%
jan 1, 2002
42.748
+1.002
2.4%
jan 1, 2003
40.824
-1.924
-4.5%
jan 1, 2004
43.149
+2.325
5.7%
jan 1, 2007
50.849
+7.699
17.84%
jan 1, 2008
52.075
+1.227
2.41%
jan 1, 2009
52.443
+0.367
0.71%
jan 1, 2010
53.501
+1.059
2.02%
jan 1, 2011
57.335
+3.834
7.17%
jan 1, 2012
63.809
+6.474
11.29%
jan 1, 2013
72.788
+8.979
14.07%
jan 1, 2014
77.793
+5.005
6.88%
jan 1, 2015
81.611
+3.818
4.91%
Ranking of countries by current statistics by years


Comments: