29
/
en
AIzaSyAYiBZKx7MnpbEhh9jyipgxe19OcubqV5w
April 1, 2024
274819
United Arab Emirates
ARE
true
2
1
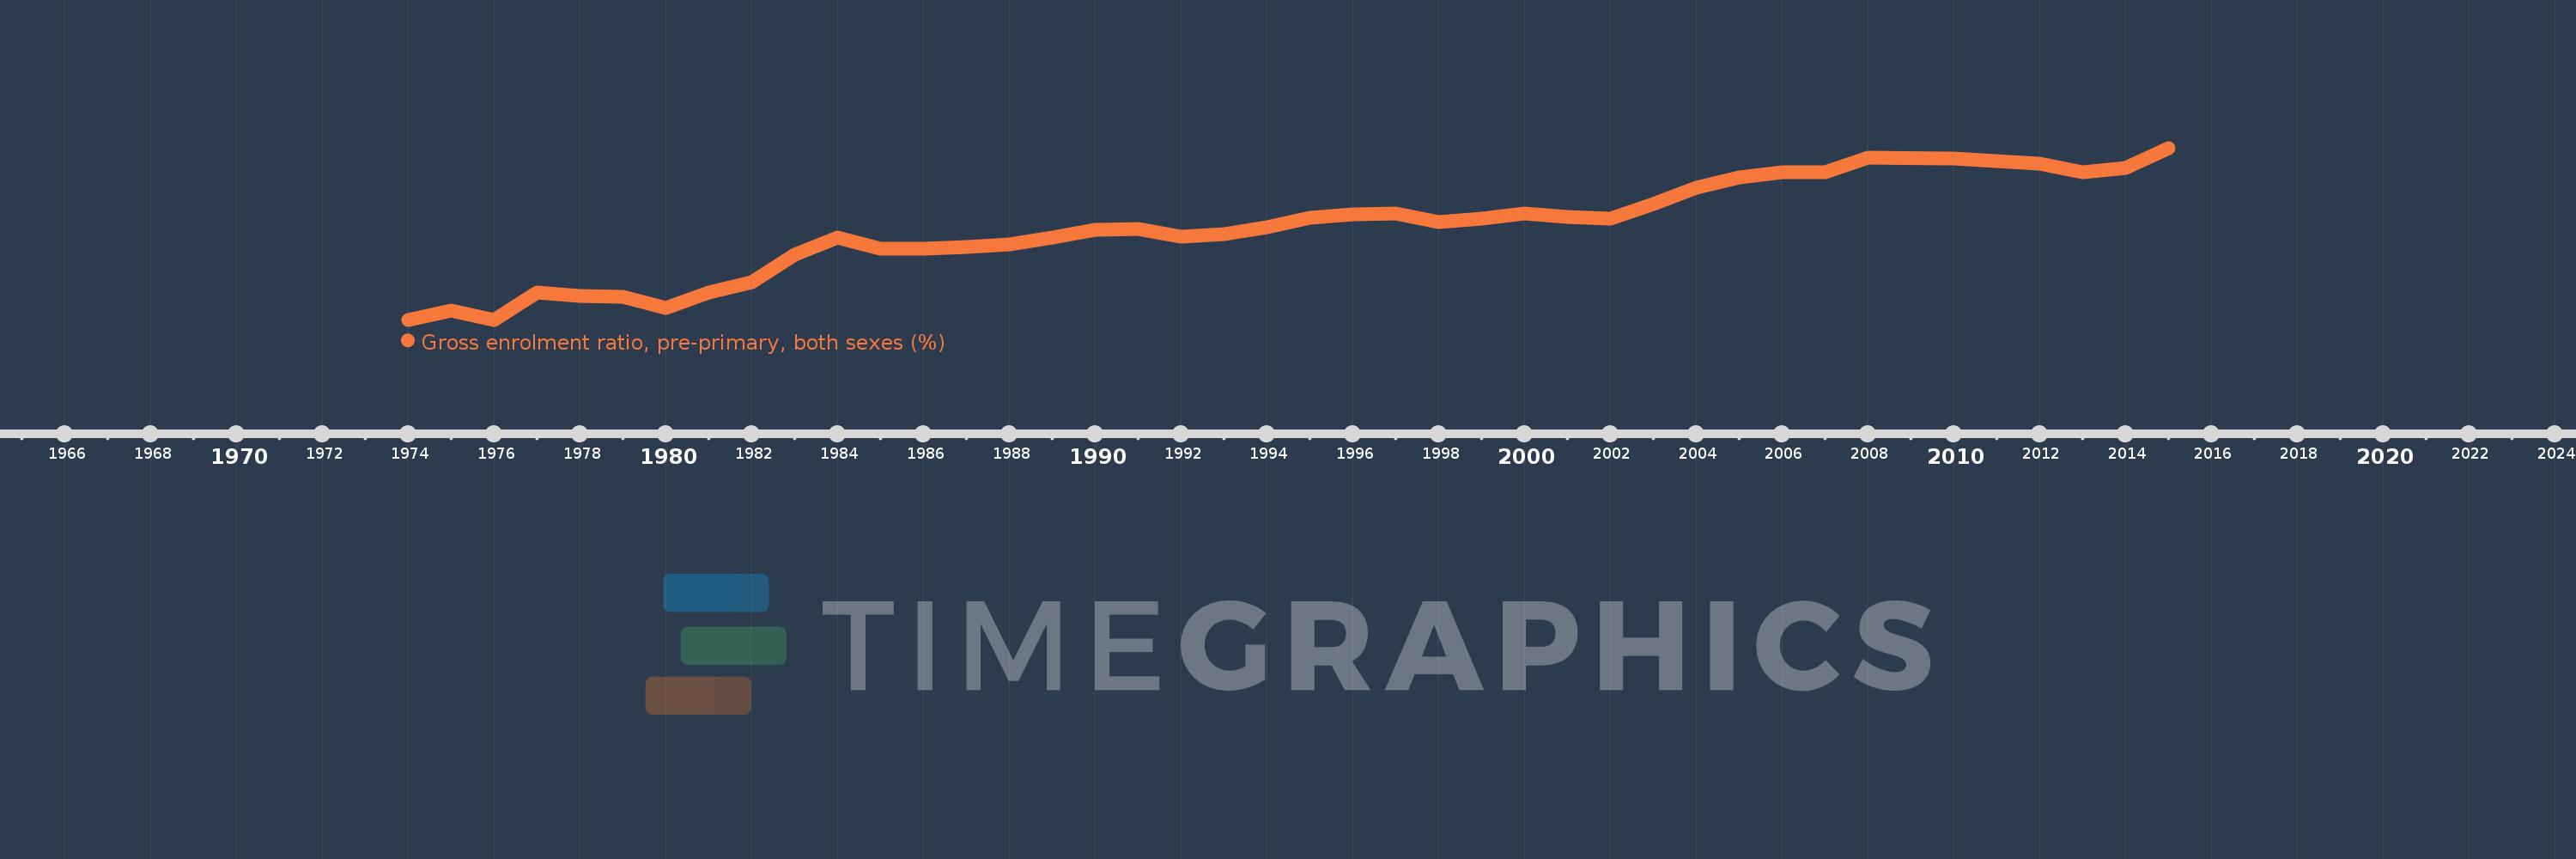
Gross enrolment ratio, pre-primary, both sexes (%)
2015,2014,2013,2012,2011,2010,2008,2007,2006,2005,2004,2003,2002,2001,2000,1999,1998,1997,1996,1995,1994,1993,1992,1991,1990,1989,1988,1987,1986,1985,1984,1983,1982,1981,1980,1979,1978,1977,1976,1975,1974
This statistics in other country:
AfghanistanAlbaniaAlgeriaAndorraAngolaAntigua and BarbudaArab WorldArgentinaArmeniaArubaAustraliaAustriaAzerbaijanBahamas, TheBahrainBangladeshBarbadosBelarusBelgiumBelizeBeninBermudaBhutanBoliviaBosnia and HerzegovinaBotswanaBrazilBritish Virgin IslandsBrunei DarussalamBulgariaBurkina FasoBurundiCabo VerdeCambodiaCameroonCanadaCaribbean small statesCentral African RepublicCentral Europe and the BalticsChadChileChinaColombiaComorosCongo, Dem. Rep.Congo, Rep.Costa RicaCote d'IvoireCroatiaCubaCyprusCzech RepublicDenmarkDjiboutiDominicaDominican RepublicEarly-demographic dividendEast Asia & PacificEast Asia & Pacific (excluding high income)East Asia & Pacific (IDA & IBRD countries)EcuadorEgypt, Arab Rep.El SalvadorEquatorial GuineaEritreaEstoniaEthiopiaEuro areaEurope & Central AsiaEurope & Central Asia (excluding high income)Europe & Central Asia (IDA & IBRD countries)European UnionFijiFinlandFragile and conflict affected situationsFranceGabonGambia, TheGeorgiaGermanyGhanaGreeceGrenadaGuatemalaGuineaGuinea-BissauGuyanaHaitiHeavily indebted poor countries (HIPC)High incomeHondurasHong Kong SAR, ChinaHungaryIBRD onlyIcelandIDA & IBRD totalIDA blendIDA onlyIDA totalIndiaIndonesiaIran, Islamic Rep.IraqIrelandIsraelItalyJamaicaJapanJordanKazakhstanKenyaKiribatiKorea, Dem. People’s Rep.Korea, Rep.KuwaitKyrgyz RepublicLao PDRLate-demographic dividendLatin America & Caribbean Latin America & Caribbean (excluding high income)Latin America & the Caribbean (IDA & IBRD countries)LatviaLeast developed countries: UN classificationLebanonLesothoLiberiaLibyaLiechtensteinLithuaniaLow & middle incomeLow incomeLower middle incomeLuxembourgMacao SAR, ChinaMacedonia, FYRMadagascarMalaysiaMaldivesMaliMaltaMarshall IslandsMauritaniaMauritiusMexicoMicronesia, Fed. Sts.Middle East & North AfricaMiddle East & North Africa (excluding high income)Middle East & North Africa (IDA & IBRD countries)Middle incomeMoldovaMongoliaMontenegroMoroccoMozambiqueMyanmarNamibiaNauruNepalNetherlandsNew ZealandNicaraguaNigerNigeriaNorth AmericaNorwayOECD membersOmanOther small statesPacific island small statesPakistanPalauPanamaPapua New GuineaParaguayPeruPhilippinesPolandPortugalPost-demographic dividendPre-demographic dividendPuerto RicoQatarRomaniaRussian FederationRwandaSamoaSan MarinoSao Tome and PrincipeSaudi ArabiaSenegalSerbiaSeychellesSierra LeoneSlovak RepublicSloveniaSmall statesSolomon IslandsSomaliaSouth AfricaSouth AsiaSouth Asia (IDA & IBRD)South SudanSpainSri LankaSt. Kitts and NevisSt. LuciaSt. Vincent and the GrenadinesSub-Saharan Africa Sub-Saharan Africa (excluding high income)Sub-Saharan Africa (IDA & IBRD countries)SudanSurinameSwazilandSwedenSwitzerlandSyrian Arab RepublicTajikistanTanzaniaThailandTimor-LesteTogoTongaTrinidad and TobagoTunisiaTurkeyTurkmenistanTuvaluUgandaUkraineUnited Arab EmiratesUnited KingdomUnited StatesUpper middle incomeUruguayUzbekistanVanuatuVenezuela, RBVietnamWest Bank and GazaWorldYemen, Rep.ZambiaZimbabwe Timeline:
This timeline shows a graph from 1974 to 2015 of United Arab Emirates. No data until 1973. Number of actual observations by date: 41.
Source name:
World Development Indicators
Source organization:
UNESCO Institute for Statistics
Categories, topics:
Education
Last updated:
apr 23, 2017
Indicators value changes by year
Minimum:
21.693
jan 1, 1976
Maximum:
91.958
jan 1, 2015
At the date of observation
Value
Absolute change
Change from previous value
jan 1, 1974
21.733
+21.733
0.0%
jan 1, 1975
25.595
+3.863
17.77%
jan 1, 1976
21.693
-3.902
-15.25%
jan 1, 1977
32.79
+11.097
51.15%
jan 1, 1978
31.524
-1.266
-3.86%
jan 1, 1979
31.197
-0.327
-1.04%
jan 1, 1980
26.336
-4.861
-15.58%
jan 1, 1981
32.764
+6.428
24.41%
jan 1, 1982
37.06
+4.296
13.11%
jan 1, 1983
48.252
+11.192
30.2%
jan 1, 1984
55.177
+6.925
14.35%
jan 1, 1985
50.812
-4.365
-7.91%
jan 1, 1986
50.748
-0.064
-0.13%
jan 1, 1987
51.494
+0.746
1.47%
jan 1, 1988
52.335
+0.841
1.63%
jan 1, 1989
55.212
+2.877
5.5%
jan 1, 1990
58.436
+3.224
5.84%
jan 1, 1991
58.82
+0.384
0.66%
jan 1, 1992
55.617
-3.202
-5.44%
jan 1, 1993
56.757
+1.139
2.05%
jan 1, 1994
59.403
+2.646
4.66%
jan 1, 1995
63.527
+4.124
6.94%
jan 1, 1996
64.837
+1.309
2.06%
jan 1, 1997
65.049
+0.213
0.33%
jan 1, 1998
61.752
-3.298
-5.07%
jan 1, 1999
62.993
+1.241
2.01%
jan 1, 2000
65.243
+2.251
3.57%
jan 1, 2001
63.775
-1.468
-2.25%
jan 1, 2002
62.933
-0.842
-1.32%
jan 1, 2003
68.911
+5.978
9.5%
jan 1, 2004
75.783
+6.872
9.97%
jan 1, 2005
79.947
+4.163
5.49%
jan 1, 2006
82.143
+2.197
2.75%
jan 1, 2007
82.119
-0.024
-0.03%
jan 1, 2008
88.017
+5.898
7.18%
jan 1, 2010
87.593
-0.424
-0.48%
jan 1, 2011
86.755
-0.838
-0.96%
jan 1, 2012
85.375
-1.38
-1.59%
jan 1, 2013
82.103
-3.272
-3.83%
jan 1, 2014
83.905
+1.802
2.2%
jan 1, 2015
91.958
+8.052
9.6%
Ranking of countries by current statistics by years


Comments: