29
/
en
AIzaSyAYiBZKx7MnpbEhh9jyipgxe19OcubqV5w
April 1, 2024
225954
Portugal
PRT
true
2
1
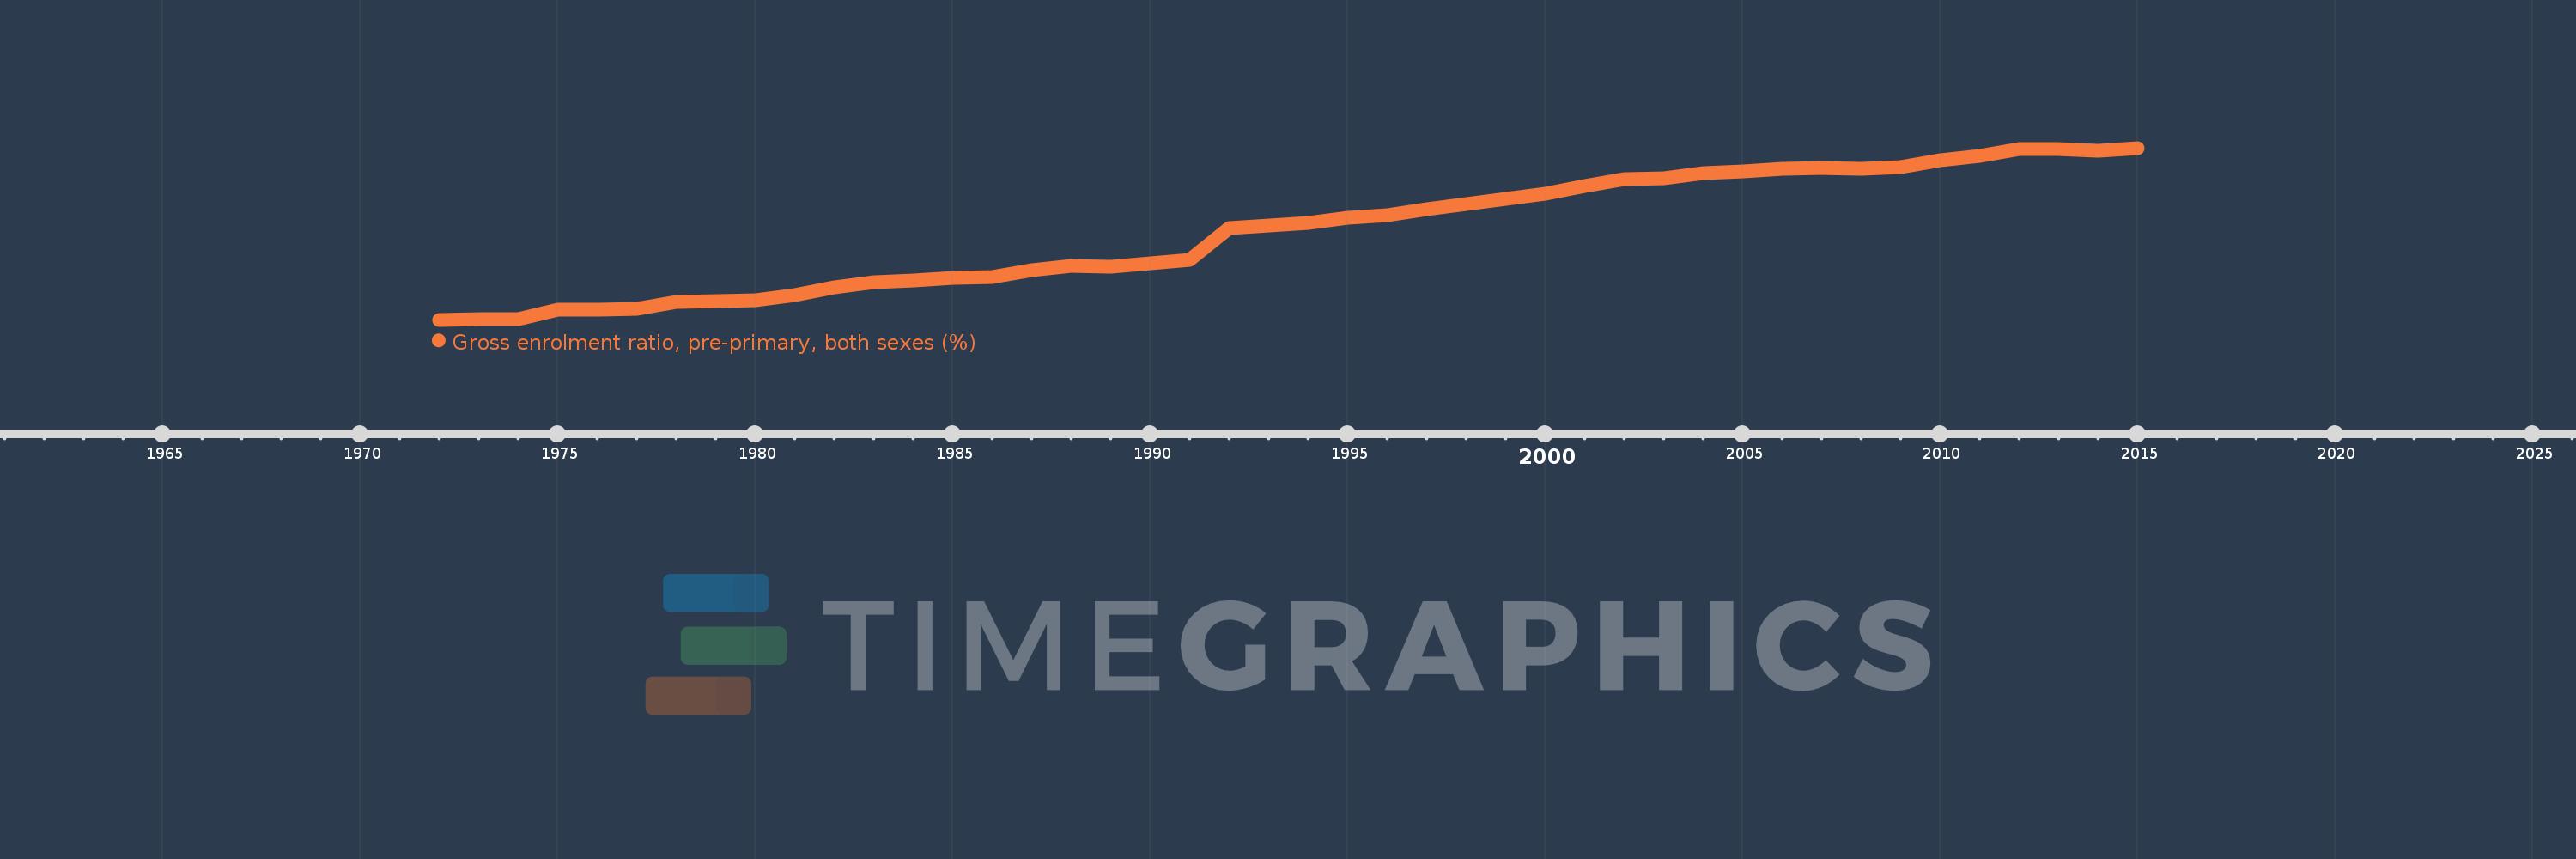
Gross enrolment ratio, pre-primary, both sexes (%)
2015,2014,2013,2012,2011,2010,2009,2008,2007,2006,2005,2004,2003,2002,2001,2000,1999,1997,1996,1995,1994,1992,1991,1989,1988,1987,1986,1985,1984,1983,1982,1981,1980,1979,1978,1977,1976,1975,1974,1973,1972
This statistics in other country:
AfghanistanAlbaniaAlgeriaAndorraAngolaAntigua and BarbudaArab WorldArgentinaArmeniaArubaAustraliaAustriaAzerbaijanBahamas, TheBahrainBangladeshBarbadosBelarusBelgiumBelizeBeninBermudaBhutanBoliviaBosnia and HerzegovinaBotswanaBrazilBritish Virgin IslandsBrunei DarussalamBulgariaBurkina FasoBurundiCabo VerdeCambodiaCameroonCanadaCaribbean small statesCentral African RepublicCentral Europe and the BalticsChadChileChinaColombiaComorosCongo, Dem. Rep.Congo, Rep.Costa RicaCote d'IvoireCroatiaCubaCyprusCzech RepublicDenmarkDjiboutiDominicaDominican RepublicEarly-demographic dividendEast Asia & PacificEast Asia & Pacific (excluding high income)East Asia & Pacific (IDA & IBRD countries)EcuadorEgypt, Arab Rep.El SalvadorEquatorial GuineaEritreaEstoniaEthiopiaEuro areaEurope & Central AsiaEurope & Central Asia (excluding high income)Europe & Central Asia (IDA & IBRD countries)European UnionFijiFinlandFragile and conflict affected situationsFranceGabonGambia, TheGeorgiaGermanyGhanaGreeceGrenadaGuatemalaGuineaGuinea-BissauGuyanaHaitiHeavily indebted poor countries (HIPC)High incomeHondurasHong Kong SAR, ChinaHungaryIBRD onlyIcelandIDA & IBRD totalIDA blendIDA onlyIDA totalIndiaIndonesiaIran, Islamic Rep.IraqIrelandIsraelItalyJamaicaJapanJordanKazakhstanKenyaKiribatiKorea, Dem. People’s Rep.Korea, Rep.KuwaitKyrgyz RepublicLao PDRLate-demographic dividendLatin America & Caribbean Latin America & Caribbean (excluding high income)Latin America & the Caribbean (IDA & IBRD countries)LatviaLeast developed countries: UN classificationLebanonLesothoLiberiaLibyaLiechtensteinLithuaniaLow & middle incomeLow incomeLower middle incomeLuxembourgMacao SAR, ChinaMacedonia, FYRMadagascarMalaysiaMaldivesMaliMaltaMarshall IslandsMauritaniaMauritiusMexicoMicronesia, Fed. Sts.Middle East & North AfricaMiddle East & North Africa (excluding high income)Middle East & North Africa (IDA & IBRD countries)Middle incomeMoldovaMongoliaMontenegroMoroccoMozambiqueMyanmarNamibiaNauruNepalNetherlandsNew ZealandNicaraguaNigerNigeriaNorth AmericaNorwayOECD membersOmanOther small statesPacific island small statesPakistanPalauPanamaPapua New GuineaParaguayPeruPhilippinesPolandPortugalPost-demographic dividendPre-demographic dividendPuerto RicoQatarRomaniaRussian FederationRwandaSamoaSan MarinoSao Tome and PrincipeSaudi ArabiaSenegalSerbiaSeychellesSierra LeoneSlovak RepublicSloveniaSmall statesSolomon IslandsSomaliaSouth AfricaSouth AsiaSouth Asia (IDA & IBRD)South SudanSpainSri LankaSt. Kitts and NevisSt. LuciaSt. Vincent and the GrenadinesSub-Saharan Africa Sub-Saharan Africa (excluding high income)Sub-Saharan Africa (IDA & IBRD countries)SudanSurinameSwazilandSwedenSwitzerlandSyrian Arab RepublicTajikistanTanzaniaThailandTimor-LesteTogoTongaTrinidad and TobagoTunisiaTurkeyTurkmenistanTuvaluUgandaUkraineUnited Arab EmiratesUnited KingdomUnited StatesUpper middle incomeUruguayUzbekistanVanuatuVenezuela, RBVietnamWest Bank and GazaWorldYemen, Rep.ZambiaZimbabwe Timeline:
This timeline shows a graph from 1972 to 2015 of Portugal. No data until 1971. Number of actual observations by date: 41.
Source name:
World Development Indicators
Source organization:
UNESCO Institute for Statistics
Categories, topics:
Education
Last updated:
apr 23, 2017
Indicators value changes by year
At the date of observation
Value
Absolute change
Change from previous value
jan 1, 1972
3.34
+3.34
0.0%
jan 1, 1973
3.719
+0.379
11.35%
jan 1, 1974
3.851
+0.131
3.53%
jan 1, 1975
8.47
+4.62
119.97%
jan 1, 1976
8.735
+0.264
3.12%
jan 1, 1977
9.172
+0.437
5.01%
jan 1, 1978
12.451
+3.279
35.75%
jan 1, 1979
12.798
+0.348
2.79%
jan 1, 1980
13.272
+0.474
3.71%
jan 1, 1981
15.828
+2.556
19.26%
jan 1, 1982
19.978
+4.15
26.22%
jan 1, 1983
22.767
+2.788
13.96%
jan 1, 1984
23.731
+0.964
4.23%
jan 1, 1985
25.058
+1.328
5.6%
jan 1, 1986
25.354
+0.296
1.18%
jan 1, 1987
28.81
+3.456
13.63%
jan 1, 1988
31.275
+2.464
8.55%
jan 1, 1989
30.753
-0.521
-1.67%
jan 1, 1991
34.388
+3.634
11.82%
jan 1, 1992
50.674
+16.287
47.36%
jan 1, 1994
53.182
+2.508
4.95%
jan 1, 1995
55.747
+2.565
4.82%
jan 1, 1996
57.154
+1.408
2.53%
jan 1, 1997
60.231
+3.077
5.38%
jan 1, 1999
65.502
+5.27
8.75%
jan 1, 2000
68.282
+2.78
4.24%
jan 1, 2001
72.418
+4.136
6.06%
jan 1, 2002
75.574
+3.156
4.36%
jan 1, 2003
76.234
+0.661
0.87%
jan 1, 2004
78.757
+2.523
3.31%
jan 1, 2005
79.568
+0.811
1.03%
jan 1, 2006
80.893
+1.325
1.67%
jan 1, 2007
81.357
+0.464
0.57%
jan 1, 2008
81.243
-0.114
-0.14%
jan 1, 2009
81.905
+0.663
0.82%
jan 1, 2010
85.332
+3.427
4.18%
jan 1, 2011
87.79
+2.458
2.88%
jan 1, 2012
91.064
+3.273
3.73%
jan 1, 2013
91.117
+0.053
0.06%
jan 1, 2014
90.569
-0.547
-0.6%
jan 1, 2015
91.82
+1.251
1.38%
Ranking of countries by current statistics by years


Comments: