29
/
en
AIzaSyAYiBZKx7MnpbEhh9jyipgxe19OcubqV5w
April 1, 2024
163810
Japan
JPN
true
2
1
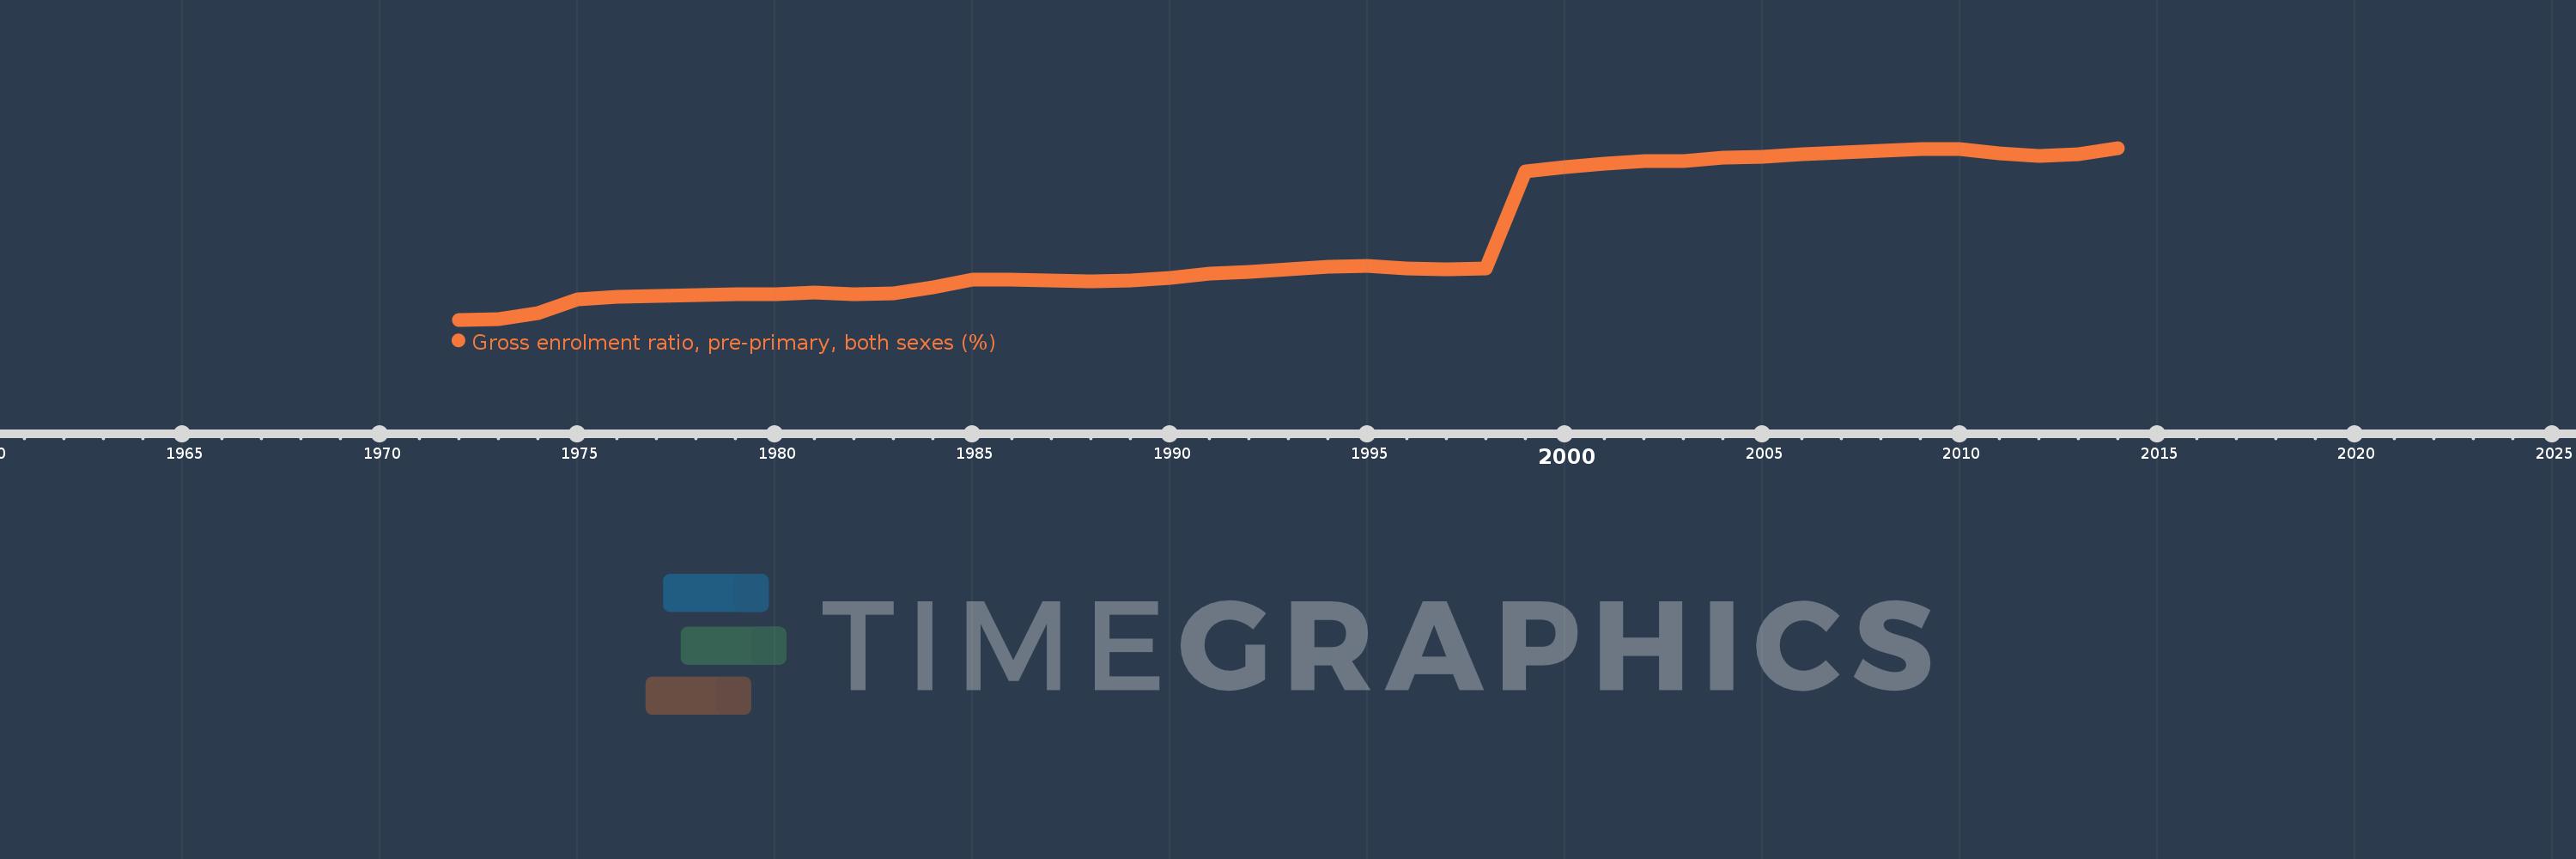
Gross enrolment ratio, pre-primary, both sexes (%)
2014,2013,2012,2011,2010,2009,2008,2007,2006,2005,2004,2003,2002,2001,2000,1999,1998,1997,1996,1995,1994,1993,1992,1991,1990,1989,1988,1987,1986,1985,1984,1983,1982,1981,1980,1979,1978,1977,1976,1975,1974,1973,1972
This statistics in other country:
AfghanistanAlbaniaAlgeriaAndorraAngolaAntigua and BarbudaArab WorldArgentinaArmeniaArubaAustraliaAustriaAzerbaijanBahamas, TheBahrainBangladeshBarbadosBelarusBelgiumBelizeBeninBermudaBhutanBoliviaBosnia and HerzegovinaBotswanaBrazilBritish Virgin IslandsBrunei DarussalamBulgariaBurkina FasoBurundiCabo VerdeCambodiaCameroonCanadaCaribbean small statesCentral African RepublicCentral Europe and the BalticsChadChileChinaColombiaComorosCongo, Dem. Rep.Congo, Rep.Costa RicaCote d'IvoireCroatiaCubaCyprusCzech RepublicDenmarkDjiboutiDominicaDominican RepublicEarly-demographic dividendEast Asia & PacificEast Asia & Pacific (excluding high income)East Asia & Pacific (IDA & IBRD countries)EcuadorEgypt, Arab Rep.El SalvadorEquatorial GuineaEritreaEstoniaEthiopiaEuro areaEurope & Central AsiaEurope & Central Asia (excluding high income)Europe & Central Asia (IDA & IBRD countries)European UnionFijiFinlandFragile and conflict affected situationsFranceGabonGambia, TheGeorgiaGermanyGhanaGreeceGrenadaGuatemalaGuineaGuinea-BissauGuyanaHaitiHeavily indebted poor countries (HIPC)High incomeHondurasHong Kong SAR, ChinaHungaryIBRD onlyIcelandIDA & IBRD totalIDA blendIDA onlyIDA totalIndiaIndonesiaIran, Islamic Rep.IraqIrelandIsraelItalyJamaicaJapanJordanKazakhstanKenyaKiribatiKorea, Dem. People’s Rep.Korea, Rep.KuwaitKyrgyz RepublicLao PDRLate-demographic dividendLatin America & Caribbean Latin America & Caribbean (excluding high income)Latin America & the Caribbean (IDA & IBRD countries)LatviaLeast developed countries: UN classificationLebanonLesothoLiberiaLibyaLiechtensteinLithuaniaLow & middle incomeLow incomeLower middle incomeLuxembourgMacao SAR, ChinaMacedonia, FYRMadagascarMalaysiaMaldivesMaliMaltaMarshall IslandsMauritaniaMauritiusMexicoMicronesia, Fed. Sts.Middle East & North AfricaMiddle East & North Africa (excluding high income)Middle East & North Africa (IDA & IBRD countries)Middle incomeMoldovaMongoliaMontenegroMoroccoMozambiqueMyanmarNamibiaNauruNepalNetherlandsNew ZealandNicaraguaNigerNigeriaNorth AmericaNorwayOECD membersOmanOther small statesPacific island small statesPakistanPalauPanamaPapua New GuineaParaguayPeruPhilippinesPolandPortugalPost-demographic dividendPre-demographic dividendPuerto RicoQatarRomaniaRussian FederationRwandaSamoaSan MarinoSao Tome and PrincipeSaudi ArabiaSenegalSerbiaSeychellesSierra LeoneSlovak RepublicSloveniaSmall statesSolomon IslandsSomaliaSouth AfricaSouth AsiaSouth Asia (IDA & IBRD)South SudanSpainSri LankaSt. Kitts and NevisSt. LuciaSt. Vincent and the GrenadinesSub-Saharan Africa Sub-Saharan Africa (excluding high income)Sub-Saharan Africa (IDA & IBRD countries)SudanSurinameSwazilandSwedenSwitzerlandSyrian Arab RepublicTajikistanTanzaniaThailandTimor-LesteTogoTongaTrinidad and TobagoTunisiaTurkeyTurkmenistanTuvaluUgandaUkraineUnited Arab EmiratesUnited KingdomUnited StatesUpper middle incomeUruguayUzbekistanVanuatuVenezuela, RBVietnamWest Bank and GazaWorldYemen, Rep.ZambiaZimbabwe Timeline:
This timeline shows a graph from 1972 to 2014 of Japan. No data until 1971. Number of actual observations by date: 43.
Source name:
World Development Indicators
Source organization:
UNESCO Institute for Statistics
Categories, topics:
Education
Last updated:
apr 23, 2017
Indicators value changes by year
Minimum:
32.582
jan 1, 1972
Maximum:
89.927
jan 1, 2014
At the date of observation
Value
Absolute change
Change from previous value
jan 1, 1972
32.582
+32.582
0.0%
jan 1, 1973
32.898
+0.315
0.97%
jan 1, 1974
34.863
+1.965
5.97%
jan 1, 1975
39.369
+4.506
12.93%
jan 1, 1976
40.297
+0.928
2.36%
jan 1, 1977
40.611
+0.314
0.78%
jan 1, 1978
40.766
+0.155
0.38%
jan 1, 1979
41.019
+0.253
0.62%
jan 1, 1980
41.036
+0.017
0.04%
jan 1, 1981
41.6
+0.564
1.38%
jan 1, 1982
41.231
-0.37
-0.89%
jan 1, 1983
41.486
+0.256
0.62%
jan 1, 1984
43.314
+1.828
4.41%
jan 1, 1985
45.957
+2.642
6.1%
jan 1, 1986
45.851
-0.106
-0.23%
jan 1, 1987
45.746
-0.104
-0.23%
jan 1, 1988
45.363
-0.384
-0.84%
jan 1, 1989
45.625
+0.263
0.58%
jan 1, 1990
46.493
+0.868
1.9%
jan 1, 1991
47.978
+1.485
3.19%
jan 1, 1992
48.66
+0.682
1.42%
jan 1, 1993
49.39
+0.731
1.5%
jan 1, 1994
50.147
+0.757
1.53%
jan 1, 1995
50.474
+0.326
0.65%
jan 1, 1996
49.769
-0.704
-1.4%
jan 1, 1997
49.286
-0.484
-0.97%
jan 1, 1998
49.679
+0.393
0.8%
jan 1, 1999
82.07
+32.392
65.2%
jan 1, 2000
83.415
+1.344
1.64%
jan 1, 2001
84.545
+1.131
1.36%
jan 1, 2002
85.457
+0.912
1.08%
jan 1, 2003
85.594
+0.137
0.16%
jan 1, 2004
86.653
+1.059
1.24%
jan 1, 2005
86.916
+0.264
0.3%
jan 1, 2006
87.701
+0.785
0.9%
jan 1, 2007
88.383
+0.682
0.78%
jan 1, 2008
88.931
+0.548
0.62%
jan 1, 2009
89.614
+0.683
0.77%
jan 1, 2010
89.696
+0.082
0.09%
jan 1, 2011
88.192
-1.504
-1.68%
jan 1, 2012
87.277
-0.916
-1.04%
jan 1, 2013
87.848
+0.571
0.65%
jan 1, 2014
89.927
+2.079
2.37%
Ranking of countries by current statistics by years


Comments: