29
/
en
AIzaSyAYiBZKx7MnpbEhh9jyipgxe19OcubqV5w
April 1, 2024
227467
Qatar
QAT
true
2
1
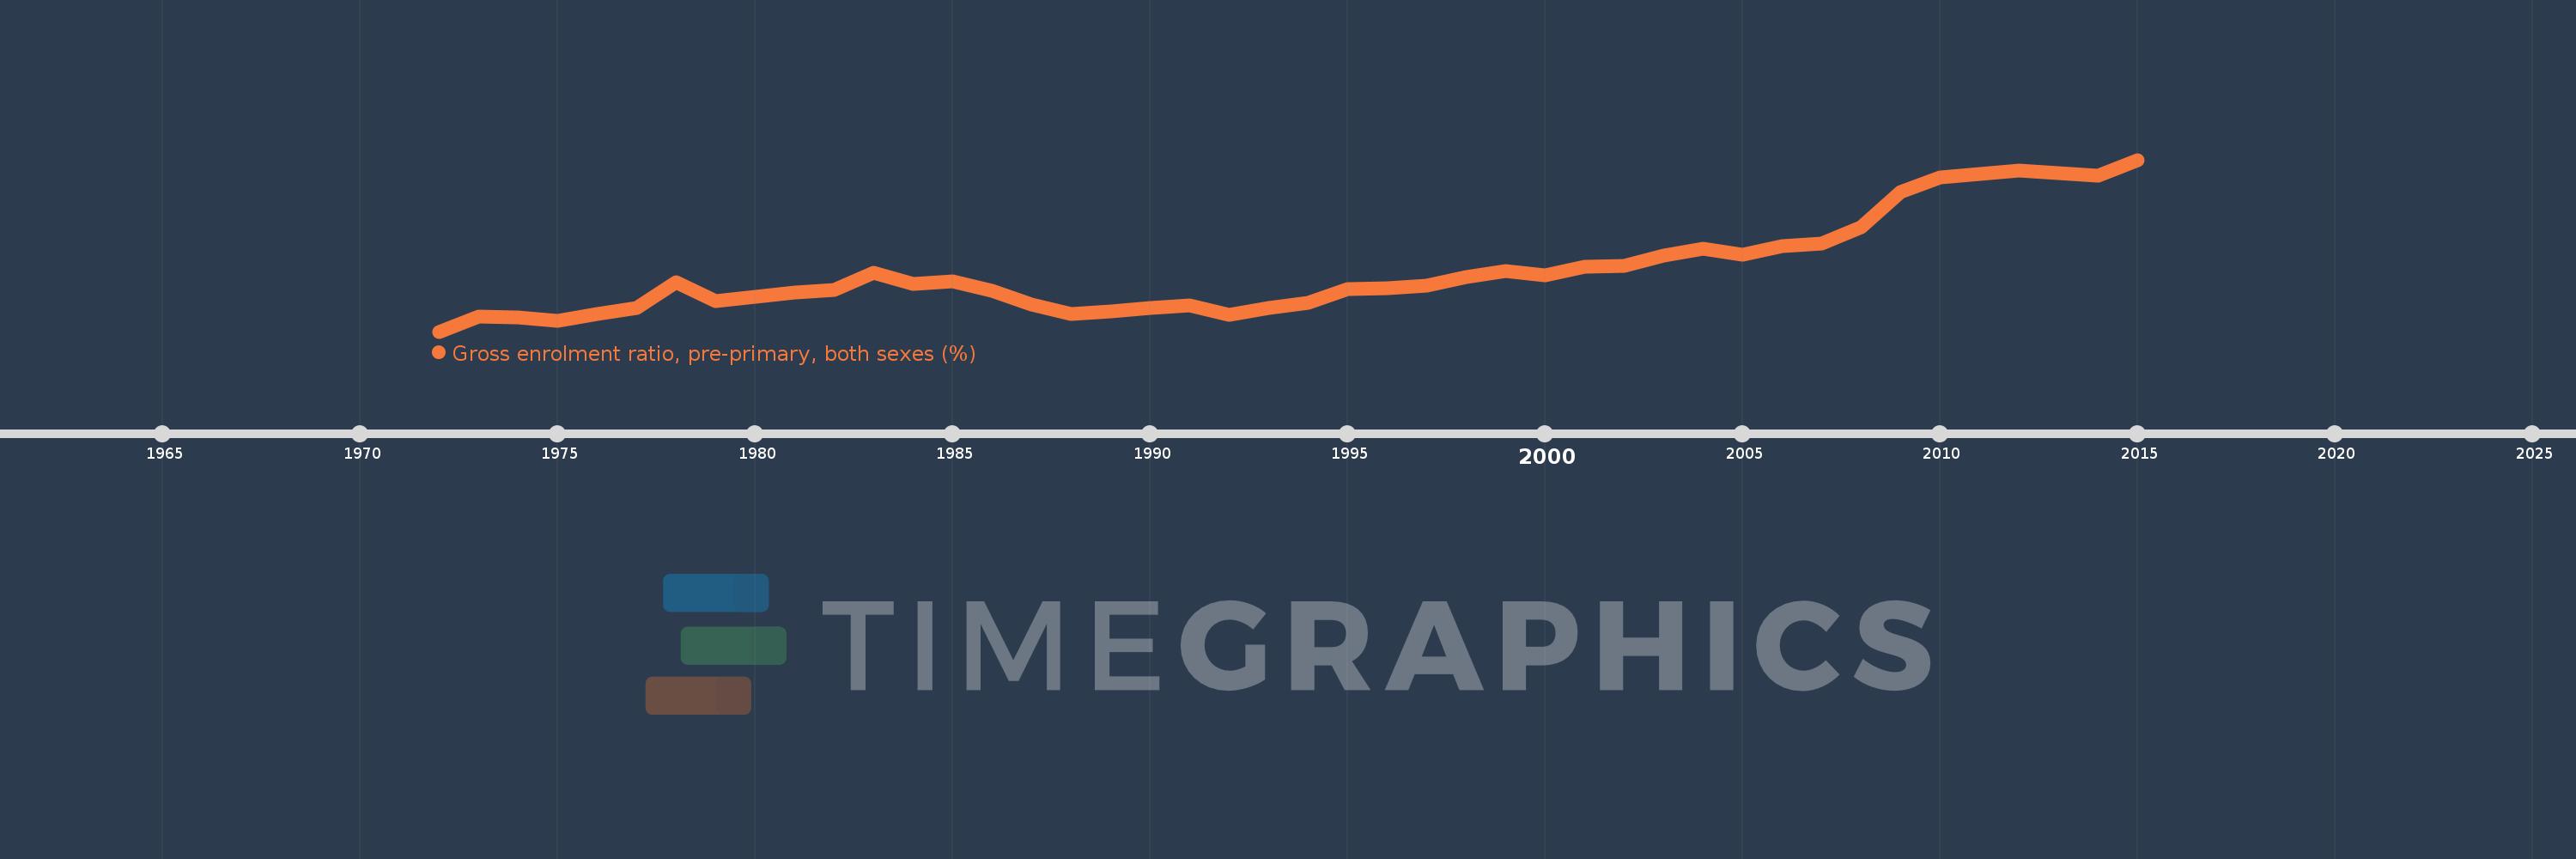
Gross enrolment ratio, pre-primary, both sexes (%)
2015,2014,2012,2010,2009,2008,2007,2006,2005,2004,2003,2002,2001,2000,1999,1998,1997,1996,1995,1994,1993,1992,1991,1990,1989,1988,1987,1986,1985,1984,1983,1982,1981,1980,1979,1978,1977,1976,1975,1974,1973,1972
This statistics in other country:
AfghanistanAlbaniaAlgeriaAndorraAngolaAntigua and BarbudaArab WorldArgentinaArmeniaArubaAustraliaAustriaAzerbaijanBahamas, TheBahrainBangladeshBarbadosBelarusBelgiumBelizeBeninBermudaBhutanBoliviaBosnia and HerzegovinaBotswanaBrazilBritish Virgin IslandsBrunei DarussalamBulgariaBurkina FasoBurundiCabo VerdeCambodiaCameroonCanadaCaribbean small statesCentral African RepublicCentral Europe and the BalticsChadChileChinaColombiaComorosCongo, Dem. Rep.Congo, Rep.Costa RicaCote d'IvoireCroatiaCubaCyprusCzech RepublicDenmarkDjiboutiDominicaDominican RepublicEarly-demographic dividendEast Asia & PacificEast Asia & Pacific (excluding high income)East Asia & Pacific (IDA & IBRD countries)EcuadorEgypt, Arab Rep.El SalvadorEquatorial GuineaEritreaEstoniaEthiopiaEuro areaEurope & Central AsiaEurope & Central Asia (excluding high income)Europe & Central Asia (IDA & IBRD countries)European UnionFijiFinlandFragile and conflict affected situationsFranceGabonGambia, TheGeorgiaGermanyGhanaGreeceGrenadaGuatemalaGuineaGuinea-BissauGuyanaHaitiHeavily indebted poor countries (HIPC)High incomeHondurasHong Kong SAR, ChinaHungaryIBRD onlyIcelandIDA & IBRD totalIDA blendIDA onlyIDA totalIndiaIndonesiaIran, Islamic Rep.IraqIrelandIsraelItalyJamaicaJapanJordanKazakhstanKenyaKiribatiKorea, Dem. People’s Rep.Korea, Rep.KuwaitKyrgyz RepublicLao PDRLate-demographic dividendLatin America & Caribbean Latin America & Caribbean (excluding high income)Latin America & the Caribbean (IDA & IBRD countries)LatviaLeast developed countries: UN classificationLebanonLesothoLiberiaLibyaLiechtensteinLithuaniaLow & middle incomeLow incomeLower middle incomeLuxembourgMacao SAR, ChinaMacedonia, FYRMadagascarMalaysiaMaldivesMaliMaltaMarshall IslandsMauritaniaMauritiusMexicoMicronesia, Fed. Sts.Middle East & North AfricaMiddle East & North Africa (excluding high income)Middle East & North Africa (IDA & IBRD countries)Middle incomeMoldovaMongoliaMontenegroMoroccoMozambiqueMyanmarNamibiaNauruNepalNetherlandsNew ZealandNicaraguaNigerNigeriaNorth AmericaNorwayOECD membersOmanOther small statesPacific island small statesPakistanPalauPanamaPapua New GuineaParaguayPeruPhilippinesPolandPortugalPost-demographic dividendPre-demographic dividendPuerto RicoQatarRomaniaRussian FederationRwandaSamoaSan MarinoSao Tome and PrincipeSaudi ArabiaSenegalSerbiaSeychellesSierra LeoneSlovak RepublicSloveniaSmall statesSolomon IslandsSomaliaSouth AfricaSouth AsiaSouth Asia (IDA & IBRD)South SudanSpainSri LankaSt. Kitts and NevisSt. LuciaSt. Vincent and the GrenadinesSub-Saharan Africa Sub-Saharan Africa (excluding high income)Sub-Saharan Africa (IDA & IBRD countries)SudanSurinameSwazilandSwedenSwitzerlandSyrian Arab RepublicTajikistanTanzaniaThailandTimor-LesteTogoTongaTrinidad and TobagoTunisiaTurkeyTurkmenistanTuvaluUgandaUkraineUnited Arab EmiratesUnited KingdomUnited StatesUpper middle incomeUruguayUzbekistanVanuatuVenezuela, RBVietnamWest Bank and GazaWorldYemen, Rep.ZambiaZimbabwe Timeline:
This timeline shows a graph from 1972 to 2015 of Qatar. No data until 1971. Number of actual observations by date: 42.
Source name:
World Development Indicators
Source organization:
UNESCO Institute for Statistics
Categories, topics:
Education
Last updated:
apr 23, 2017
Indicators value changes by year
Minimum:
11.653
jan 1, 1972
Maximum:
58.488
jan 1, 2015
At the date of observation
Value
Absolute change
Change from previous value
jan 1, 1972
11.653
+11.653
0.0%
jan 1, 1973
15.669
+4.016
34.47%
jan 1, 1974
15.54
-0.129
-0.83%
jan 1, 1975
14.657
-0.883
-5.68%
jan 1, 1976
16.43
+1.773
12.1%
jan 1, 1977
18.031
+1.601
9.75%
jan 1, 1978
25.042
+7.011
38.88%
jan 1, 1979
19.914
-5.128
-20.48%
jan 1, 1980
21.184
+1.271
6.38%
jan 1, 1981
22.413
+1.228
5.8%
jan 1, 1982
23.026
+0.613
2.74%
jan 1, 1983
27.677
+4.65
20.2%
jan 1, 1984
24.67
-3.007
-10.86%
jan 1, 1985
25.398
+0.728
2.95%
jan 1, 1986
22.744
-2.654
-10.45%
jan 1, 1987
19.033
-3.711
-16.32%
jan 1, 1988
16.508
-2.525
-13.27%
jan 1, 1989
17.26
+0.752
4.56%
jan 1, 1990
18.138
+0.877
5.08%
jan 1, 1991
18.894
+0.757
4.17%
jan 1, 1992
16.188
-2.707
-14.32%
jan 1, 1993
18.065
+1.877
11.59%
jan 1, 1994
19.544
+1.479
8.19%
jan 1, 1995
23.281
+3.737
19.12%
jan 1, 1996
23.43
+0.149
0.64%
jan 1, 1997
24.196
+0.766
3.27%
jan 1, 1998
26.44
+2.244
9.28%
jan 1, 1999
28.252
+1.812
6.85%
jan 1, 2000
27.041
-1.211
-4.28%
jan 1, 2001
29.278
+2.237
8.27%
jan 1, 2002
29.621
+0.343
1.17%
jan 1, 2003
32.487
+2.866
9.67%
jan 1, 2004
34.35
+1.863
5.73%
jan 1, 2005
32.625
-1.725
-5.02%
jan 1, 2006
34.933
+2.308
7.07%
jan 1, 2007
35.615
+0.682
1.95%
jan 1, 2008
40.058
+4.443
12.48%
jan 1, 2009
49.703
+9.645
24.08%
jan 1, 2010
53.631
+3.927
7.9%
jan 1, 2012
55.594
+1.963
3.66%
jan 1, 2014
54.202
-1.392
-2.5%
jan 1, 2015
58.488
+4.286
7.91%
Ranking of countries by current statistics by years


Comments: