29
/
en
AIzaSyAYiBZKx7MnpbEhh9jyipgxe19OcubqV5w
April 1, 2024
32646
Europe & Central Asia (IDA & IBRD countries)
TEC
false
2
1
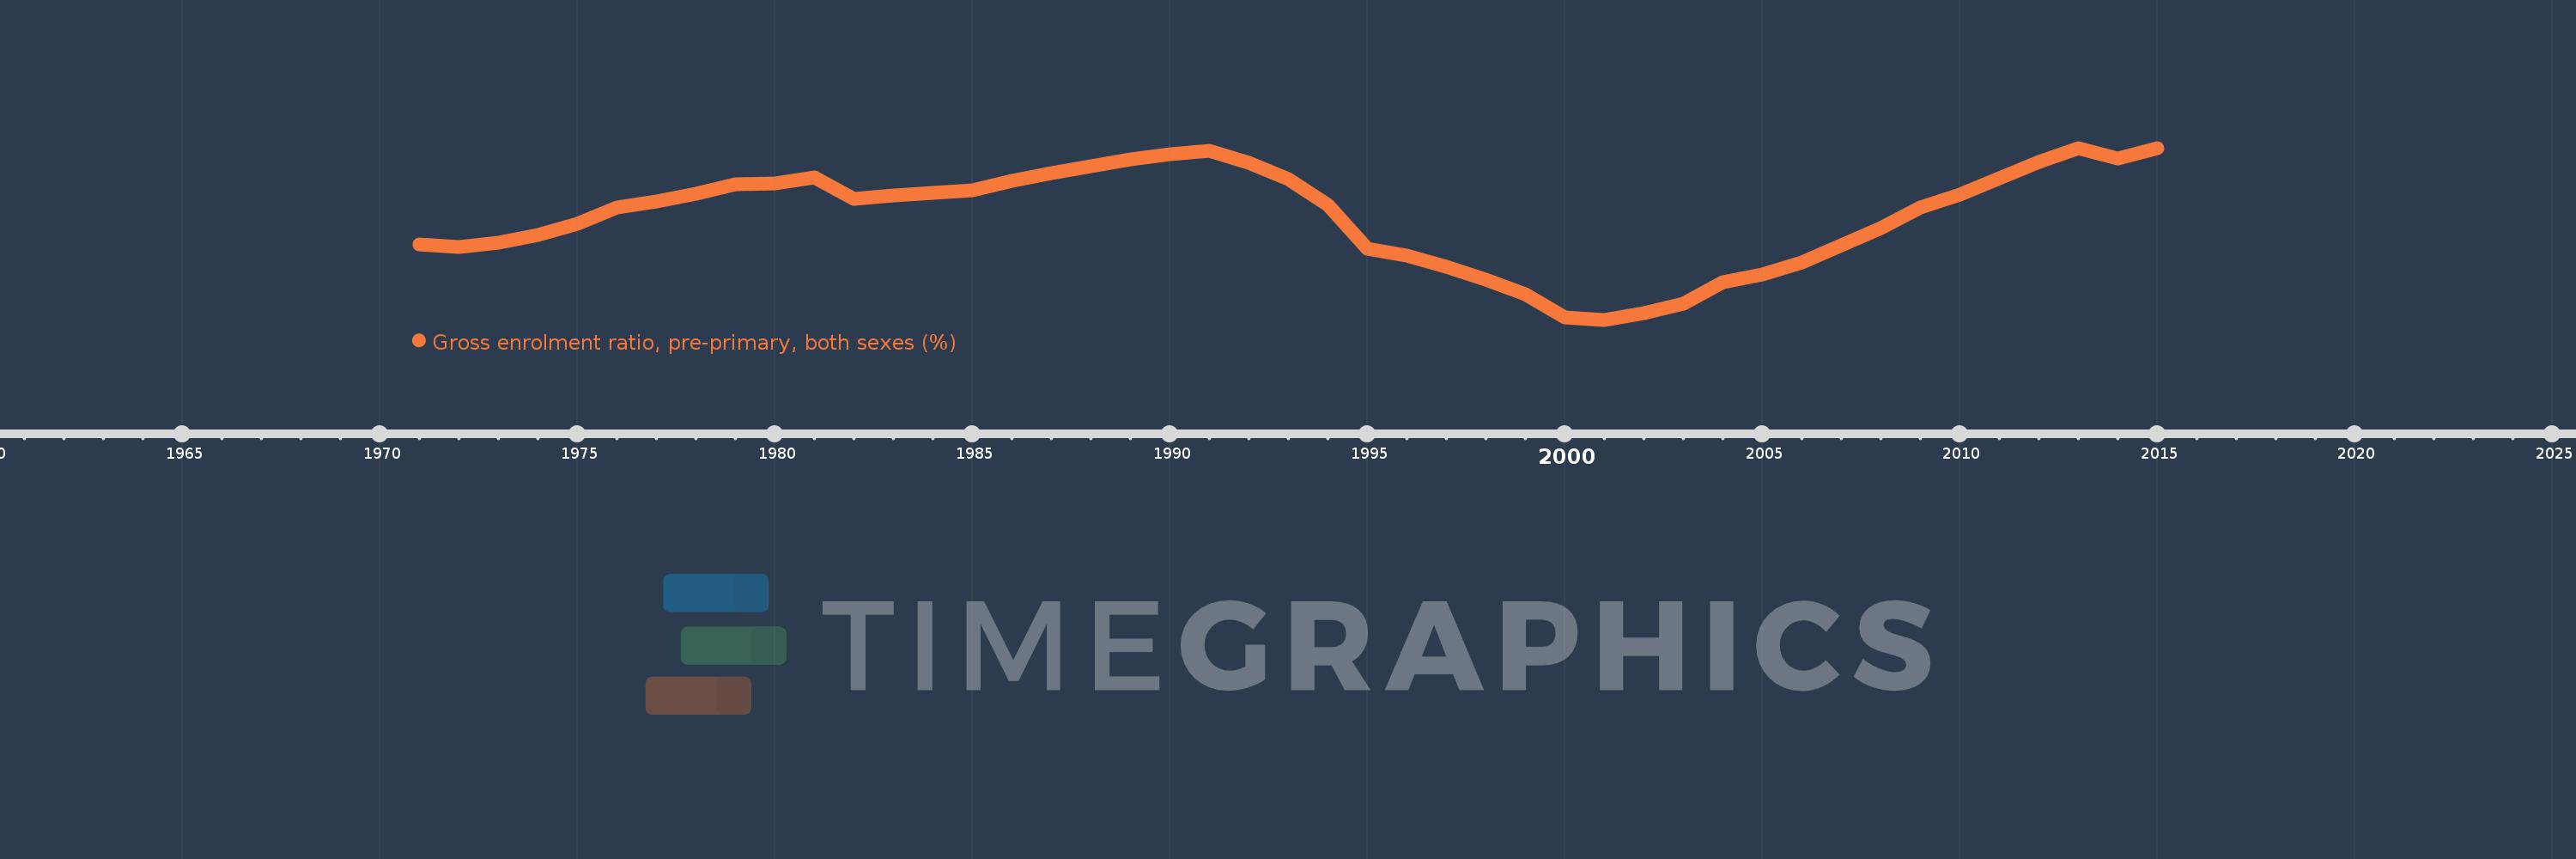
Gross enrolment ratio, pre-primary, both sexes (%)
2015,2014,2013,2012,2011,2010,2009,2008,2007,2006,2005,2004,2003,2002,2001,2000,1999,1998,1997,1996,1995,1994,1993,1992,1991,1990,1989,1988,1987,1986,1985,1984,1983,1982,1981,1980,1979,1978,1977,1976,1975,1974,1973,1972,1971
This statistics in other country:
AfghanistanAlbaniaAlgeriaAndorraAngolaAntigua and BarbudaArab WorldArgentinaArmeniaArubaAustraliaAustriaAzerbaijanBahamas, TheBahrainBangladeshBarbadosBelarusBelgiumBelizeBeninBermudaBhutanBoliviaBosnia and HerzegovinaBotswanaBrazilBritish Virgin IslandsBrunei DarussalamBulgariaBurkina FasoBurundiCabo VerdeCambodiaCameroonCanadaCaribbean small statesCentral African RepublicCentral Europe and the BalticsChadChileChinaColombiaComorosCongo, Dem. Rep.Congo, Rep.Costa RicaCote d'IvoireCroatiaCubaCyprusCzech RepublicDenmarkDjiboutiDominicaDominican RepublicEarly-demographic dividendEast Asia & PacificEast Asia & Pacific (excluding high income)East Asia & Pacific (IDA & IBRD countries)EcuadorEgypt, Arab Rep.El SalvadorEquatorial GuineaEritreaEstoniaEthiopiaEuro areaEurope & Central AsiaEurope & Central Asia (excluding high income)Europe & Central Asia (IDA & IBRD countries)European UnionFijiFinlandFragile and conflict affected situationsFranceGabonGambia, TheGeorgiaGermanyGhanaGreeceGrenadaGuatemalaGuineaGuinea-BissauGuyanaHaitiHeavily indebted poor countries (HIPC)High incomeHondurasHong Kong SAR, ChinaHungaryIBRD onlyIcelandIDA & IBRD totalIDA blendIDA onlyIDA totalIndiaIndonesiaIran, Islamic Rep.IraqIrelandIsraelItalyJamaicaJapanJordanKazakhstanKenyaKiribatiKorea, Dem. People’s Rep.Korea, Rep.KuwaitKyrgyz RepublicLao PDRLate-demographic dividendLatin America & Caribbean Latin America & Caribbean (excluding high income)Latin America & the Caribbean (IDA & IBRD countries)LatviaLeast developed countries: UN classificationLebanonLesothoLiberiaLibyaLiechtensteinLithuaniaLow & middle incomeLow incomeLower middle incomeLuxembourgMacao SAR, ChinaMacedonia, FYRMadagascarMalaysiaMaldivesMaliMaltaMarshall IslandsMauritaniaMauritiusMexicoMicronesia, Fed. Sts.Middle East & North AfricaMiddle East & North Africa (excluding high income)Middle East & North Africa (IDA & IBRD countries)Middle incomeMoldovaMongoliaMontenegroMoroccoMozambiqueMyanmarNamibiaNauruNepalNetherlandsNew ZealandNicaraguaNigerNigeriaNorth AmericaNorwayOECD membersOmanOther small statesPacific island small statesPakistanPalauPanamaPapua New GuineaParaguayPeruPhilippinesPolandPortugalPost-demographic dividendPre-demographic dividendPuerto RicoQatarRomaniaRussian FederationRwandaSamoaSan MarinoSao Tome and PrincipeSaudi ArabiaSenegalSerbiaSeychellesSierra LeoneSlovak RepublicSloveniaSmall statesSolomon IslandsSomaliaSouth AfricaSouth AsiaSouth Asia (IDA & IBRD)South SudanSpainSri LankaSt. Kitts and NevisSt. LuciaSt. Vincent and the GrenadinesSub-Saharan Africa Sub-Saharan Africa (excluding high income)Sub-Saharan Africa (IDA & IBRD countries)SudanSurinameSwazilandSwedenSwitzerlandSyrian Arab RepublicTajikistanTanzaniaThailandTimor-LesteTogoTongaTrinidad and TobagoTunisiaTurkeyTurkmenistanTuvaluUgandaUkraineUnited Arab EmiratesUnited KingdomUnited StatesUpper middle incomeUruguayUzbekistanVanuatuVenezuela, RBVietnamWest Bank and GazaWorldYemen, Rep.ZambiaZimbabwe Timeline:
This timeline shows a graph from 1971 to 2015 of Europe & Central Asia (IDA & IBRD countries). No data until 1970. Number of actual observations by date: 45.
Source name:
World Development Indicators
Source organization:
UNESCO Institute for Statistics
Categories, topics:
Education
Last updated:
apr 23, 2017
Indicators value changes by year
Minimum:
39.272
jan 1, 2001
Maximum:
57.906
jan 1, 2013
At the date of observation
Value
Absolute change
Change from previous value
jan 1, 1971
47.442
+47.442
0.0%
jan 1, 1972
47.169
-0.273
-0.58%
jan 1, 1973
47.638
+0.469
0.99%
jan 1, 1974
48.514
+0.876
1.84%
jan 1, 1975
49.65
+1.137
2.34%
jan 1, 1976
51.488
+1.838
3.7%
jan 1, 1977
52.118
+0.63
1.22%
jan 1, 1978
52.91
+0.792
1.52%
jan 1, 1979
53.922
+1.012
1.91%
jan 1, 1980
54.065
+0.142
0.26%
jan 1, 1981
54.697
+0.633
1.17%
jan 1, 1982
52.421
-2.276
-4.16%
jan 1, 1983
52.708
+0.287
0.55%
jan 1, 1984
53.008
+0.3
0.57%
jan 1, 1985
53.333
+0.325
0.61%
jan 1, 1986
54.311
+0.978
1.83%
jan 1, 1987
55.163
+0.851
1.57%
jan 1, 1988
55.956
+0.793
1.44%
jan 1, 1989
56.638
+0.683
1.22%
jan 1, 1990
57.201
+0.562
0.99%
jan 1, 1991
57.622
+0.421
0.74%
jan 1, 1992
56.298
-1.324
-2.3%
jan 1, 1993
54.528
-1.77
-3.14%
jan 1, 1994
51.763
-2.765
-5.07%
jan 1, 1995
46.967
-4.796
-9.27%
jan 1, 1996
46.272
-0.696
-1.48%
jan 1, 1997
45.039
-1.233
-2.66%
jan 1, 1998
43.604
-1.435
-3.19%
jan 1, 1999
42.013
-1.591
-3.65%
jan 1, 2000
39.478
-2.535
-6.03%
jan 1, 2001
39.272
-0.206
-0.52%
jan 1, 2002
39.971
+0.698
1.78%
jan 1, 2003
40.996
+1.025
2.56%
jan 1, 2004
43.357
+2.362
5.76%
jan 1, 2005
44.21
+0.853
1.97%
jan 1, 2006
45.516
+1.306
2.95%
jan 1, 2007
47.345
+1.829
4.02%
jan 1, 2008
49.188
+1.843
3.89%
jan 1, 2009
51.437
+2.25
4.57%
jan 1, 2010
52.89
+1.452
2.82%
jan 1, 2011
54.656
+1.767
3.34%
jan 1, 2012
56.351
+1.695
3.1%
jan 1, 2013
57.906
+1.555
2.76%
jan 1, 2014
56.759
-1.147
-1.98%
jan 1, 2015
57.864
+1.105
1.95%
Ranking of countries by current statistics by years


Comments: