29
/
en
AIzaSyAYiBZKx7MnpbEhh9jyipgxe19OcubqV5w
April 1, 2024
282344
Vietnam
VNM
true
2
1
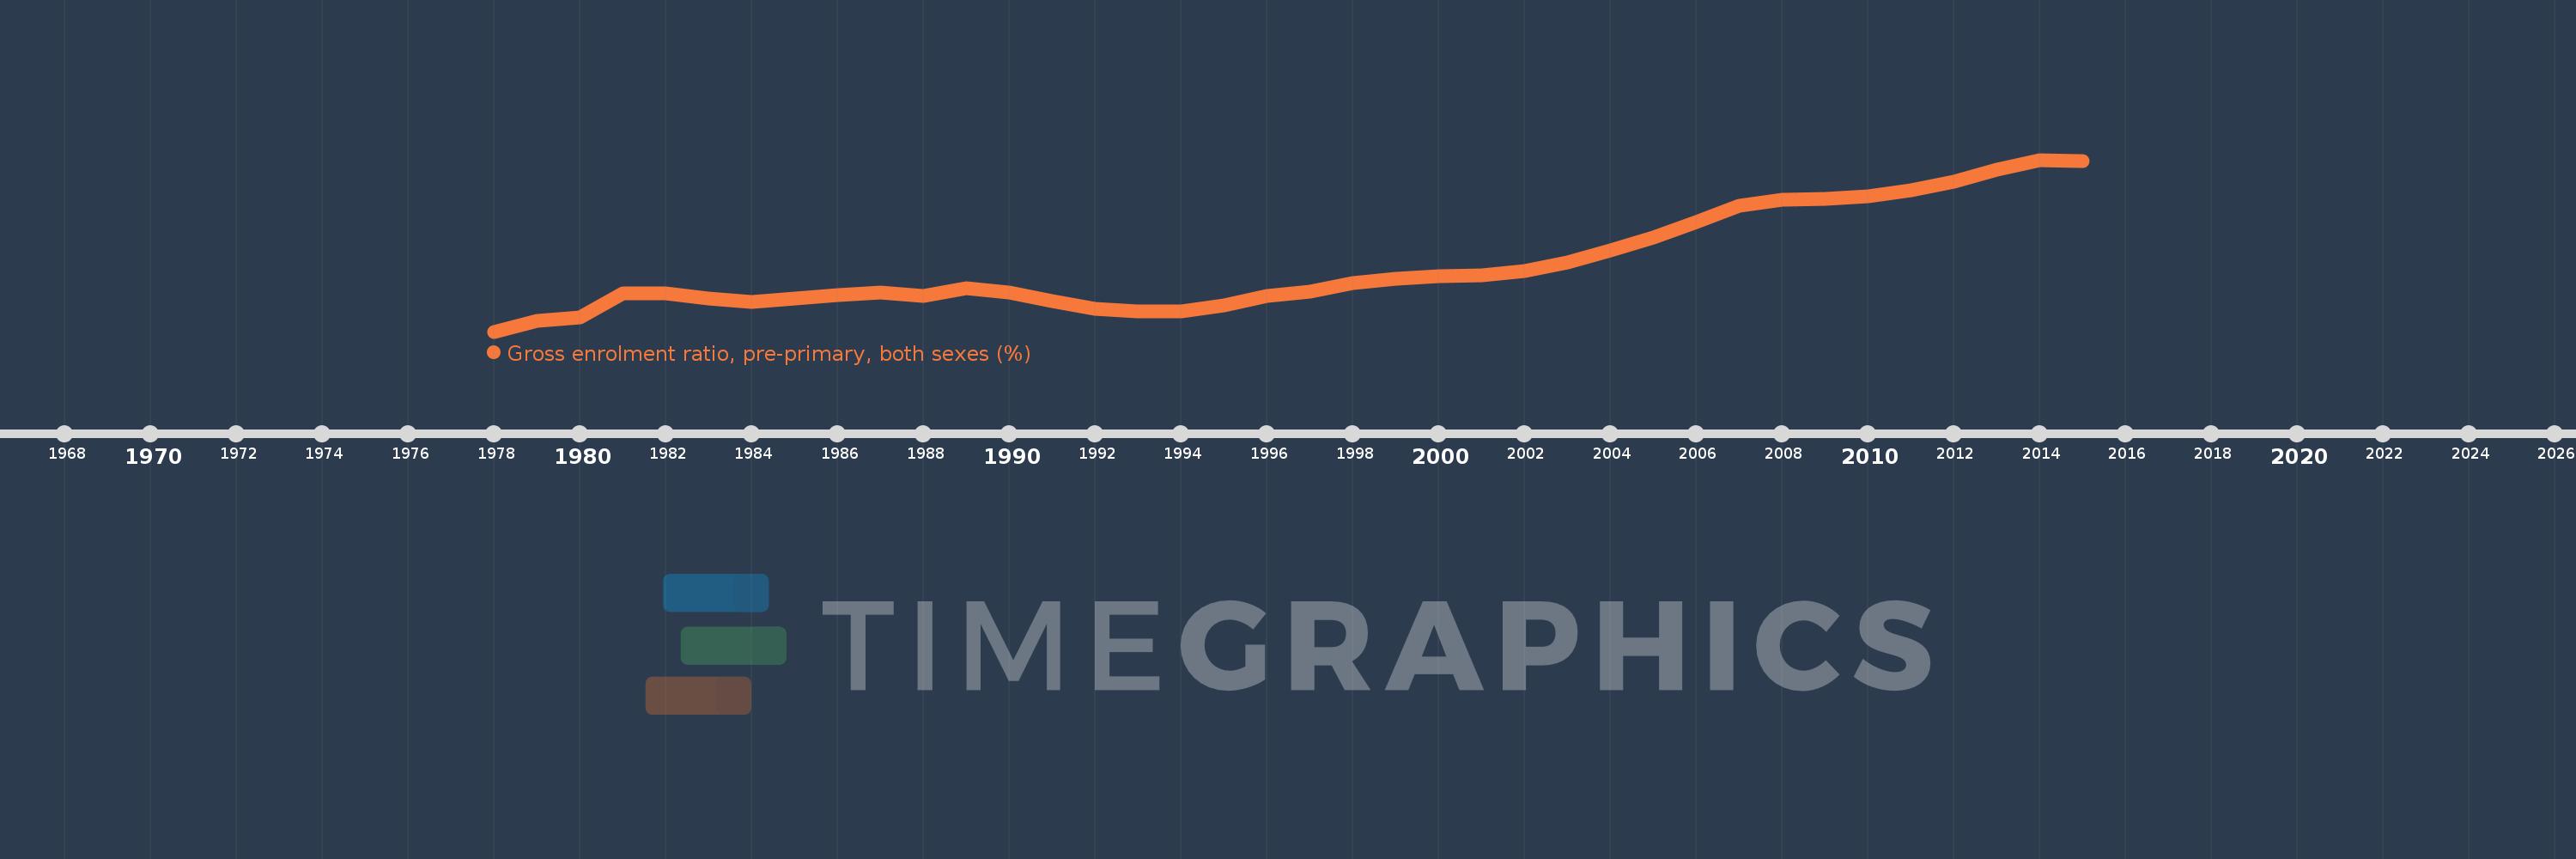
Gross enrolment ratio, pre-primary, both sexes (%)
2015,2014,2013,2012,2011,2010,2009,2008,2007,2006,2005,2004,2003,2002,2001,2000,1999,1998,1997,1996,1995,1994,1993,1992,1991,1990,1989,1988,1987,1986,1984,1983,1982,1981,1980,1979,1978
This statistics in other country:
AfghanistanAlbaniaAlgeriaAndorraAngolaAntigua and BarbudaArab WorldArgentinaArmeniaArubaAustraliaAustriaAzerbaijanBahamas, TheBahrainBangladeshBarbadosBelarusBelgiumBelizeBeninBermudaBhutanBoliviaBosnia and HerzegovinaBotswanaBrazilBritish Virgin IslandsBrunei DarussalamBulgariaBurkina FasoBurundiCabo VerdeCambodiaCameroonCanadaCaribbean small statesCentral African RepublicCentral Europe and the BalticsChadChileChinaColombiaComorosCongo, Dem. Rep.Congo, Rep.Costa RicaCote d'IvoireCroatiaCubaCyprusCzech RepublicDenmarkDjiboutiDominicaDominican RepublicEarly-demographic dividendEast Asia & PacificEast Asia & Pacific (excluding high income)East Asia & Pacific (IDA & IBRD countries)EcuadorEgypt, Arab Rep.El SalvadorEquatorial GuineaEritreaEstoniaEthiopiaEuro areaEurope & Central AsiaEurope & Central Asia (excluding high income)Europe & Central Asia (IDA & IBRD countries)European UnionFijiFinlandFragile and conflict affected situationsFranceGabonGambia, TheGeorgiaGermanyGhanaGreeceGrenadaGuatemalaGuineaGuinea-BissauGuyanaHaitiHeavily indebted poor countries (HIPC)High incomeHondurasHong Kong SAR, ChinaHungaryIBRD onlyIcelandIDA & IBRD totalIDA blendIDA onlyIDA totalIndiaIndonesiaIran, Islamic Rep.IraqIrelandIsraelItalyJamaicaJapanJordanKazakhstanKenyaKiribatiKorea, Dem. People’s Rep.Korea, Rep.KuwaitKyrgyz RepublicLao PDRLate-demographic dividendLatin America & Caribbean Latin America & Caribbean (excluding high income)Latin America & the Caribbean (IDA & IBRD countries)LatviaLeast developed countries: UN classificationLebanonLesothoLiberiaLibyaLiechtensteinLithuaniaLow & middle incomeLow incomeLower middle incomeLuxembourgMacao SAR, ChinaMacedonia, FYRMadagascarMalaysiaMaldivesMaliMaltaMarshall IslandsMauritaniaMauritiusMexicoMicronesia, Fed. Sts.Middle East & North AfricaMiddle East & North Africa (excluding high income)Middle East & North Africa (IDA & IBRD countries)Middle incomeMoldovaMongoliaMontenegroMoroccoMozambiqueMyanmarNamibiaNauruNepalNetherlandsNew ZealandNicaraguaNigerNigeriaNorth AmericaNorwayOECD membersOmanOther small statesPacific island small statesPakistanPalauPanamaPapua New GuineaParaguayPeruPhilippinesPolandPortugalPost-demographic dividendPre-demographic dividendPuerto RicoQatarRomaniaRussian FederationRwandaSamoaSan MarinoSao Tome and PrincipeSaudi ArabiaSenegalSerbiaSeychellesSierra LeoneSlovak RepublicSloveniaSmall statesSolomon IslandsSomaliaSouth AfricaSouth AsiaSouth Asia (IDA & IBRD)South SudanSpainSri LankaSt. Kitts and NevisSt. LuciaSt. Vincent and the GrenadinesSub-Saharan Africa Sub-Saharan Africa (excluding high income)Sub-Saharan Africa (IDA & IBRD countries)SudanSurinameSwazilandSwedenSwitzerlandSyrian Arab RepublicTajikistanTanzaniaThailandTimor-LesteTogoTongaTrinidad and TobagoTunisiaTurkeyTurkmenistanTuvaluUgandaUkraineUnited Arab EmiratesUnited KingdomUnited StatesUpper middle incomeUruguayUzbekistanVanuatuVenezuela, RBVietnamWest Bank and GazaWorldYemen, Rep.ZambiaZimbabwe Timeline:
This timeline shows a graph from 1978 to 2015 of Vietnam. No data until 1977. Number of actual observations by date: 37.
Source name:
World Development Indicators
Source organization:
UNESCO Institute for Statistics
Categories, topics:
Education
Last updated:
apr 23, 2017
Indicators value changes by year
Minimum:
20.373
jan 1, 1978
Maximum:
81.749
jan 1, 2014
At the date of observation
Value
Absolute change
Change from previous value
jan 1, 1978
20.373
+20.373
0.0%
jan 1, 1979
24.291
+3.918
19.23%
jan 1, 1980
25.52
+1.23
5.06%
jan 1, 1981
33.947
+8.426
33.02%
jan 1, 1982
33.94
-0.006
-0.02%
jan 1, 1983
32.248
-1.692
-4.99%
jan 1, 1984
30.817
-1.431
-4.44%
jan 1, 1986
33.498
+2.681
8.7%
jan 1, 1987
34.442
+0.944
2.82%
jan 1, 1988
33.118
-1.324
-3.84%
jan 1, 1989
36.022
+2.905
8.77%
jan 1, 1990
34.375
-1.648
-4.57%
jan 1, 1991
31.411
-2.964
-8.62%
jan 1, 1992
28.545
-2.866
-9.13%
jan 1, 1993
27.459
-1.085
-3.8%
jan 1, 1994
27.619
+0.16
0.58%
jan 1, 1995
29.837
+2.218
8.03%
jan 1, 1996
33.017
+3.18
10.66%
jan 1, 1997
34.702
+1.685
5.1%
jan 1, 1998
37.668
+2.966
8.55%
jan 1, 1999
39.238
+1.57
4.17%
jan 1, 2000
40.072
+0.834
2.12%
jan 1, 2001
40.509
+0.437
1.09%
jan 1, 2002
41.999
+1.49
3.68%
jan 1, 2003
44.994
+2.995
7.13%
jan 1, 2004
49.231
+4.237
9.42%
jan 1, 2005
53.963
+4.732
9.61%
jan 1, 2006
59.401
+5.438
10.08%
jan 1, 2007
65.215
+5.814
9.79%
jan 1, 2008
67.543
+2.328
3.57%
jan 1, 2009
67.757
+0.214
0.32%
jan 1, 2010
68.846
+1.089
1.61%
jan 1, 2011
70.753
+1.907
2.77%
jan 1, 2012
73.974
+3.221
4.55%
jan 1, 2013
78.257
+4.282
5.79%
jan 1, 2014
81.749
+3.492
4.46%
jan 1, 2015
81.354
-0.394
-0.48%
Ranking of countries by current statistics by years


Comments: