29
/
en
AIzaSyAYiBZKx7MnpbEhh9jyipgxe19OcubqV5w
April 1, 2024
133197
Finland
FIN
true
2
1
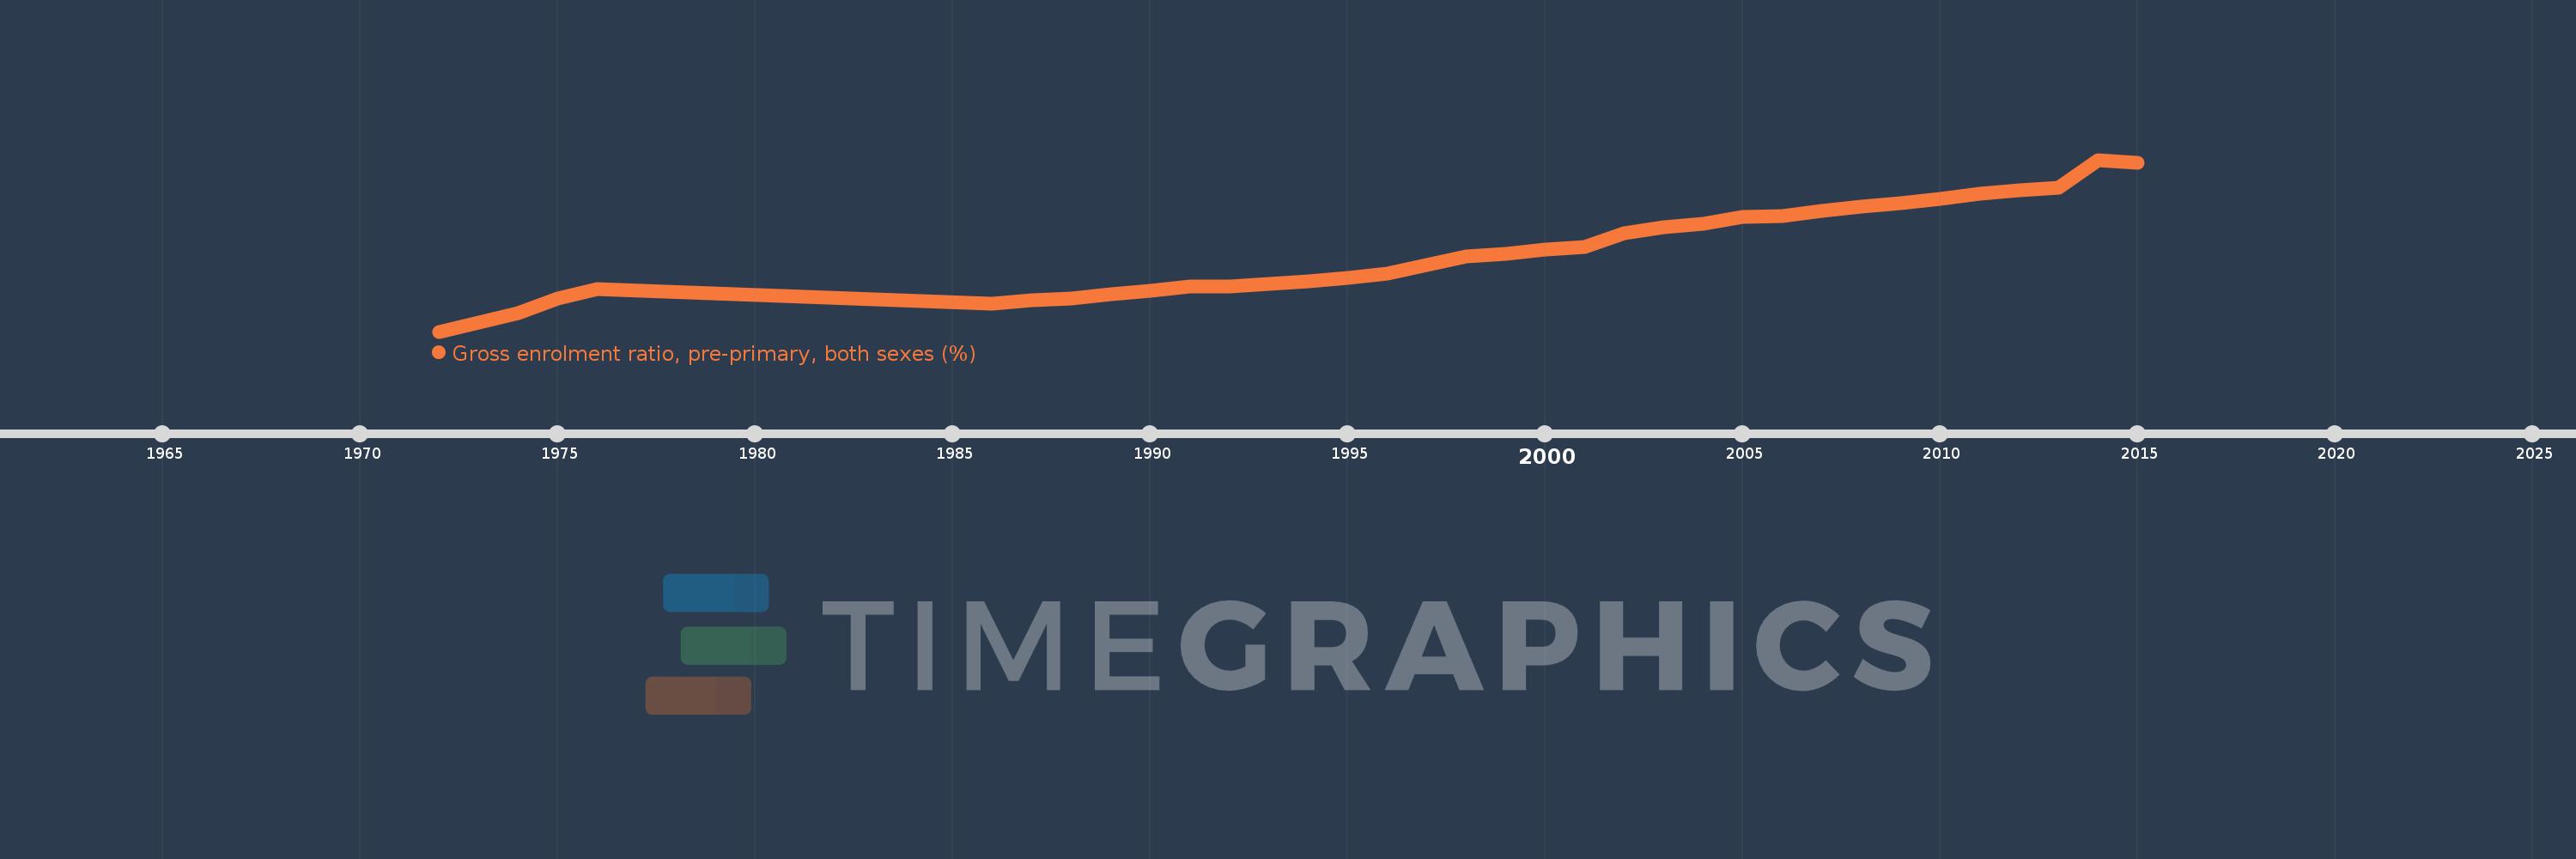
Gross enrolment ratio, pre-primary, both sexes (%)
2015,2014,2013,2012,2011,2010,2009,2008,2007,2006,2005,2004,2003,2002,2001,2000,1999,1998,1997,1996,1995,1994,1993,1992,1991,1990,1989,1988,1987,1986,1976,1975,1974,1972
This statistics in other country:
AfghanistanAlbaniaAlgeriaAndorraAngolaAntigua and BarbudaArab WorldArgentinaArmeniaArubaAustraliaAustriaAzerbaijanBahamas, TheBahrainBangladeshBarbadosBelarusBelgiumBelizeBeninBermudaBhutanBoliviaBosnia and HerzegovinaBotswanaBrazilBritish Virgin IslandsBrunei DarussalamBulgariaBurkina FasoBurundiCabo VerdeCambodiaCameroonCanadaCaribbean small statesCentral African RepublicCentral Europe and the BalticsChadChileChinaColombiaComorosCongo, Dem. Rep.Congo, Rep.Costa RicaCote d'IvoireCroatiaCubaCyprusCzech RepublicDenmarkDjiboutiDominicaDominican RepublicEarly-demographic dividendEast Asia & PacificEast Asia & Pacific (excluding high income)East Asia & Pacific (IDA & IBRD countries)EcuadorEgypt, Arab Rep.El SalvadorEquatorial GuineaEritreaEstoniaEthiopiaEuro areaEurope & Central AsiaEurope & Central Asia (excluding high income)Europe & Central Asia (IDA & IBRD countries)European UnionFijiFinlandFragile and conflict affected situationsFranceGabonGambia, TheGeorgiaGermanyGhanaGreeceGrenadaGuatemalaGuineaGuinea-BissauGuyanaHaitiHeavily indebted poor countries (HIPC)High incomeHondurasHong Kong SAR, ChinaHungaryIBRD onlyIcelandIDA & IBRD totalIDA blendIDA onlyIDA totalIndiaIndonesiaIran, Islamic Rep.IraqIrelandIsraelItalyJamaicaJapanJordanKazakhstanKenyaKiribatiKorea, Dem. People’s Rep.Korea, Rep.KuwaitKyrgyz RepublicLao PDRLate-demographic dividendLatin America & Caribbean Latin America & Caribbean (excluding high income)Latin America & the Caribbean (IDA & IBRD countries)LatviaLeast developed countries: UN classificationLebanonLesothoLiberiaLibyaLiechtensteinLithuaniaLow & middle incomeLow incomeLower middle incomeLuxembourgMacao SAR, ChinaMacedonia, FYRMadagascarMalaysiaMaldivesMaliMaltaMarshall IslandsMauritaniaMauritiusMexicoMicronesia, Fed. Sts.Middle East & North AfricaMiddle East & North Africa (excluding high income)Middle East & North Africa (IDA & IBRD countries)Middle incomeMoldovaMongoliaMontenegroMoroccoMozambiqueMyanmarNamibiaNauruNepalNetherlandsNew ZealandNicaraguaNigerNigeriaNorth AmericaNorwayOECD membersOmanOther small statesPacific island small statesPakistanPalauPanamaPapua New GuineaParaguayPeruPhilippinesPolandPortugalPost-demographic dividendPre-demographic dividendPuerto RicoQatarRomaniaRussian FederationRwandaSamoaSan MarinoSao Tome and PrincipeSaudi ArabiaSenegalSerbiaSeychellesSierra LeoneSlovak RepublicSloveniaSmall statesSolomon IslandsSomaliaSouth AfricaSouth AsiaSouth Asia (IDA & IBRD)South SudanSpainSri LankaSt. Kitts and NevisSt. LuciaSt. Vincent and the GrenadinesSub-Saharan Africa Sub-Saharan Africa (excluding high income)Sub-Saharan Africa (IDA & IBRD countries)SudanSurinameSwazilandSwedenSwitzerlandSyrian Arab RepublicTajikistanTanzaniaThailandTimor-LesteTogoTongaTrinidad and TobagoTunisiaTurkeyTurkmenistanTuvaluUgandaUkraineUnited Arab EmiratesUnited KingdomUnited StatesUpper middle incomeUruguayUzbekistanVanuatuVenezuela, RBVietnamWest Bank and GazaWorldYemen, Rep.ZambiaZimbabwe Timeline:
This timeline shows a graph from 1972 to 2015 of Finland. No data until 1971. Number of actual observations by date: 34.
Source name:
World Development Indicators
Source organization:
UNESCO Institute for Statistics
Categories, topics:
Education
Last updated:
apr 23, 2017
Indicators value changes by year
Maximum:
80.889
jan 1, 2014
At the date of observation
Value
Absolute change
Change from previous value
jan 1, 1972
16.87
+16.87
0.0%
jan 1, 1974
23.839
+6.969
41.31%
jan 1, 1975
29.232
+5.393
22.62%
jan 1, 1976
32.57
+3.339
11.42%
jan 1, 1986
27.432
-5.139
-15.78%
jan 1, 1987
28.498
+1.066
3.89%
jan 1, 1988
29.164
+0.667
2.34%
jan 1, 1989
30.836
+1.672
5.73%
jan 1, 1990
32.157
+1.321
4.28%
jan 1, 1991
33.597
+1.44
4.48%
jan 1, 1992
33.628
+0.031
0.09%
jan 1, 1993
34.785
+1.157
3.44%
jan 1, 1994
35.628
+0.843
2.42%
jan 1, 1995
36.952
+1.325
3.72%
jan 1, 1996
38.489
+1.536
4.16%
jan 1, 1997
41.66
+3.172
8.24%
jan 1, 1998
45.018
+3.358
8.06%
jan 1, 1999
45.879
+0.86
1.91%
jan 1, 2000
47.376
+1.497
3.26%
jan 1, 2001
48.534
+1.159
2.45%
jan 1, 2002
53.537
+5.003
10.31%
jan 1, 2003
55.777
+2.24
4.18%
jan 1, 2004
57.042
+1.266
2.27%
jan 1, 2005
59.736
+2.694
4.72%
jan 1, 2006
60.038
+0.302
0.5%
jan 1, 2007
61.827
+1.789
2.98%
jan 1, 2008
63.516
+1.69
2.73%
jan 1, 2009
64.824
+1.308
2.06%
jan 1, 2010
66.239
+1.414
2.18%
jan 1, 2011
68.152
+1.913
2.89%
jan 1, 2012
69.517
+1.365
2.0%
jan 1, 2013
70.395
+0.878
1.26%
jan 1, 2014
80.889
+10.494
14.91%
jan 1, 2015
79.787
-1.101
-1.36%
Ranking of countries by current statistics by years


Comments: