29
/
en
AIzaSyAYiBZKx7MnpbEhh9jyipgxe19OcubqV5w
April 1, 2024
45282
Low & middle income
LMY
false
2
1
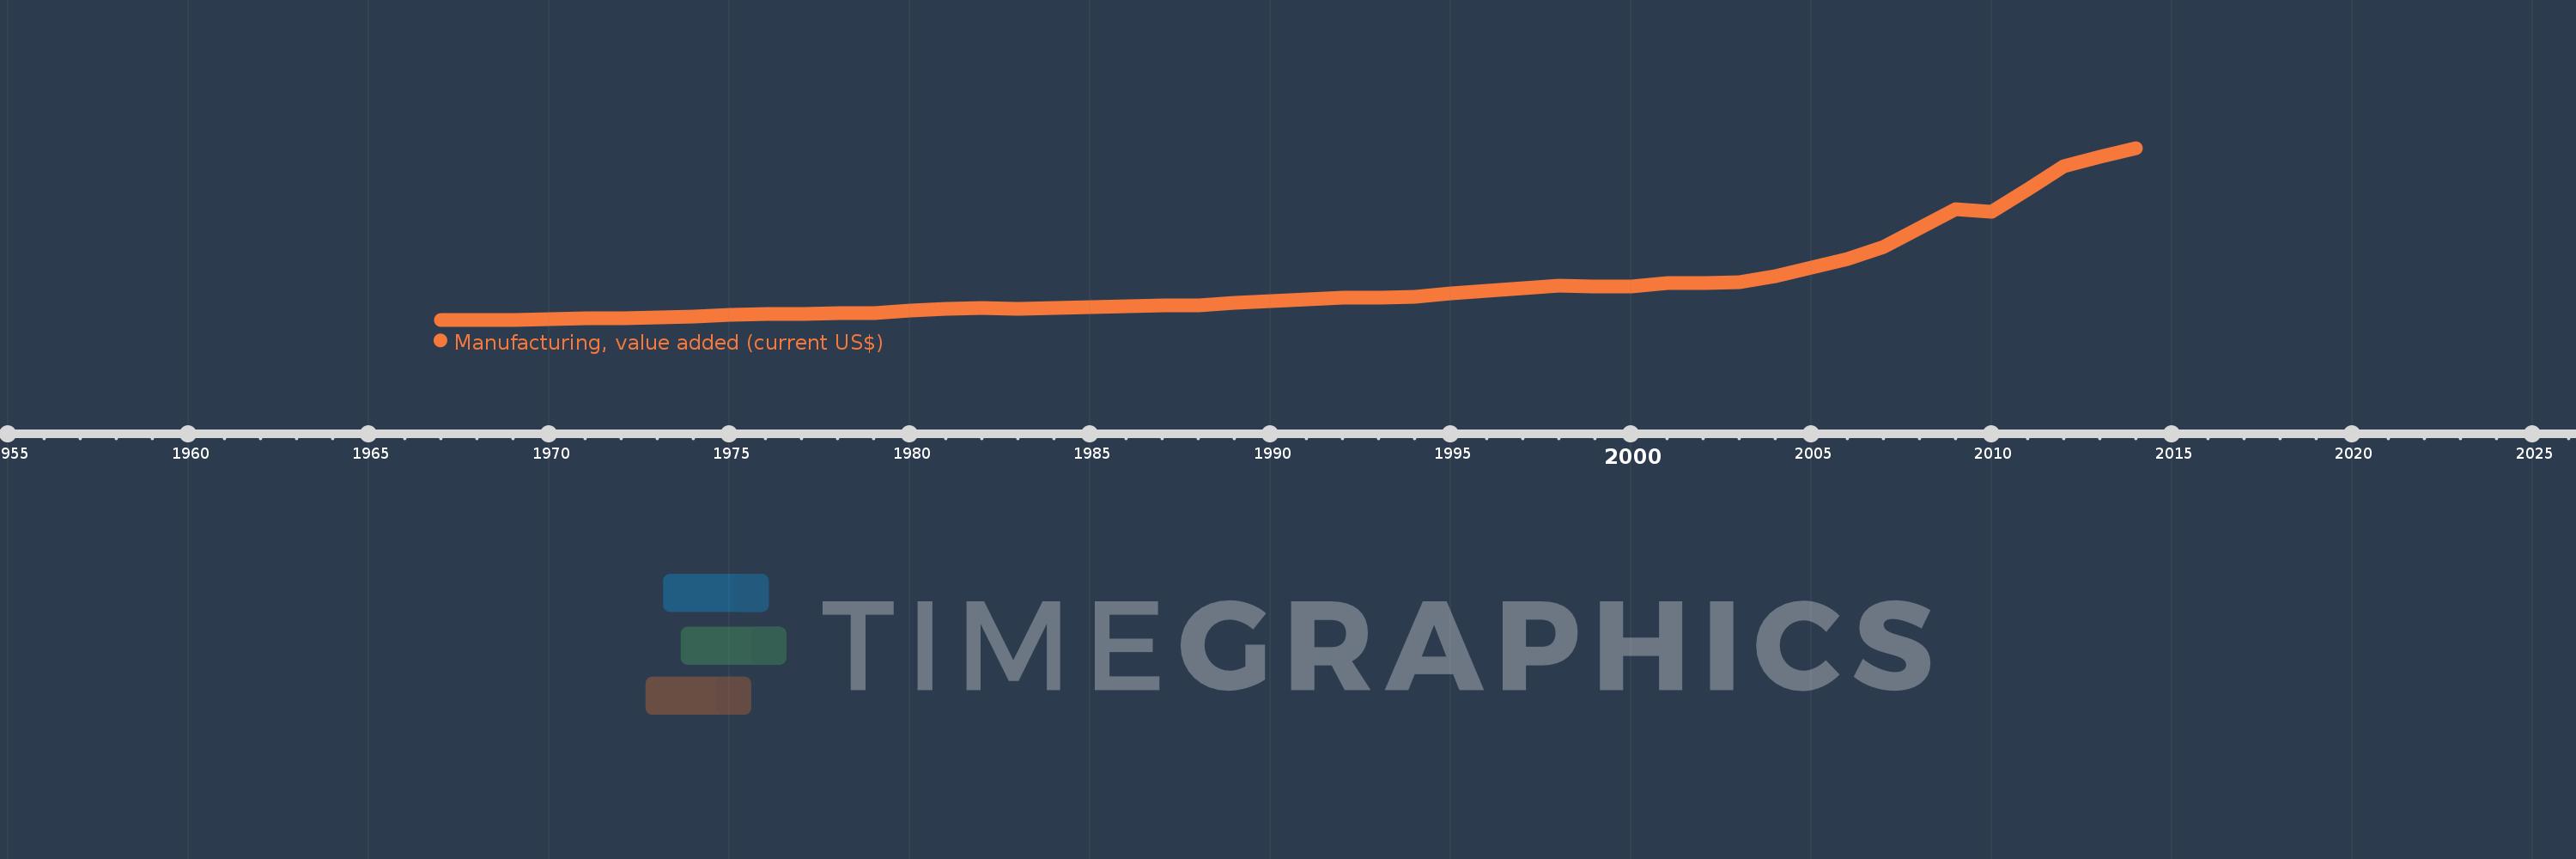
Manufacturing, value added (current US$)
2014,2013,2012,2011,2010,2009,2008,2007,2006,2005,2004,2003,2002,2001,2000,1999,1998,1997,1996,1995,1994,1993,1992,1991,1990,1989,1988,1987,1986,1985,1984,1983,1982,1981,1980,1979,1978,1977,1976,1975,1974,1973,1972,1971,1970,1969,1968,1967
This statistics in other country:
AfghanistanAlbaniaAlgeriaAndorraAngolaAntigua and BarbudaArab WorldArgentinaArmeniaArubaAustraliaAustriaAzerbaijanBahamas, TheBahrainBangladeshBarbadosBelarusBelgiumBelizeBeninBermudaBhutanBoliviaBosnia and HerzegovinaBotswanaBrazilBrunei DarussalamBurkina FasoBurundiCabo VerdeCambodiaCameroonCanadaCaribbean small statesCayman IslandsCentral African RepublicCentral Europe and the BalticsChadChileChinaColombiaComorosCongo, Dem. Rep.Congo, Rep.Costa RicaCote d'IvoireCroatiaCubaCyprusCzech RepublicDenmarkDjiboutiDominicaDominican RepublicEarly-demographic dividendEast Asia & PacificEast Asia & Pacific (excluding high income)East Asia & Pacific (IDA & IBRD countries)EcuadorEgypt, Arab Rep.El SalvadorEquatorial GuineaEritreaEstoniaEthiopiaEuro areaEurope & Central AsiaEurope & Central Asia (excluding high income)Europe & Central Asia (IDA & IBRD countries)European UnionFaroe IslandsFijiFinlandFragile and conflict affected situationsFranceGabonGambia, TheGeorgiaGermanyGhanaGreeceGrenadaGuatemalaGuineaGuinea-BissauGuyanaHeavily indebted poor countries (HIPC)High incomeHondurasHong Kong SAR, ChinaHungaryIBRD onlyIcelandIDA & IBRD totalIDA blendIDA onlyIDA totalIndiaIndonesiaIran, Islamic Rep.IraqIrelandItalyJamaicaJapanJordanKazakhstanKenyaKiribatiKorea, Rep.KosovoKuwaitKyrgyz RepublicLao PDRLate-demographic dividendLatin America & Caribbean Latin America & Caribbean (excluding high income)Latin America & the Caribbean (IDA & IBRD countries)LatviaLeast developed countries: UN classificationLebanonLesothoLiberiaLibyaLithuaniaLow & middle incomeLow incomeLower middle incomeLuxembourgMacao SAR, ChinaMacedonia, FYRMadagascarMalawiMalaysiaMaldivesMaliMaltaMarshall IslandsMauritaniaMauritiusMexicoMicronesia, Fed. Sts.Middle East & North AfricaMiddle East & North Africa (excluding high income)Middle East & North Africa (IDA & IBRD countries)Middle incomeMoldovaMongoliaMontenegroMoroccoMozambiqueMyanmarNamibiaNepalNetherlandsNew CaledoniaNew ZealandNicaraguaNigerNigeriaNorth AmericaNorwayOECD membersOmanOther small statesPacific island small statesPakistanPalauPanamaPapua New GuineaParaguayPeruPhilippinesPolandPortugalPost-demographic dividendPre-demographic dividendPuerto RicoQatarRomaniaRussian FederationRwandaSamoaSao Tome and PrincipeSaudi ArabiaSenegalSerbiaSeychellesSierra LeoneSingaporeSlovak RepublicSloveniaSmall statesSolomon IslandsSouth AfricaSouth AsiaSouth Asia (IDA & IBRD)SpainSri LankaSt. Kitts and NevisSt. LuciaSt. Vincent and the GrenadinesSub-Saharan Africa Sub-Saharan Africa (excluding high income)Sub-Saharan Africa (IDA & IBRD countries)SudanSurinameSwazilandSwedenSwitzerlandSyrian Arab RepublicTajikistanTanzaniaThailandTimor-LesteTogoTongaTrinidad and TobagoTunisiaTurkeyTurkmenistanTuvaluUgandaUkraineUnited Arab EmiratesUnited KingdomUnited StatesUpper middle incomeUruguayUzbekistanVanuatuVenezuela, RBVietnamWest Bank and GazaWorldYemen, Rep.ZambiaZimbabwe Timeline:
This timeline shows a graph from 1967 to 2014 of Low & middle income. No data until 1966. Number of actual observations by date: 48.
Source name:
World Development Indicators
Source organization:
World Bank national accounts data, and OECD National Accounts data files.
Categories, topics:
Economy & Growth
Last updated:
apr 23, 2017
Indicators value changes by year
Minimum:
74.71 bln
jan 1, 1968
Maximum:
5.29 trl
jan 1, 2014
At the date of observation
Value
Absolute change
Change from previous value
jan 1, 1967
77.767 bln
+77.767 bln
0.0%
jan 1, 1968
74.71 bln
-3.057 bln
-3.93%
jan 1, 1969
76.001 bln
+1.291 bln
1.73%
jan 1, 1970
89.913 bln
+13.913 bln
18.31%
jan 1, 1971
106.774 bln
+16.861 bln
18.75%
jan 1, 1972
118.028 bln
+11.254 bln
10.54%
jan 1, 1973
139.105 bln
+21.077 bln
17.86%
jan 1, 1974
177.882 bln
+38.777 bln
27.88%
jan 1, 1975
213.911 bln
+36.029 bln
20.25%
jan 1, 1976
237.003 bln
+23.092 bln
10.8%
jan 1, 1977
246.298 bln
+9.295 bln
3.92%
jan 1, 1978
279.825 bln
+33.527 bln
13.61%
jan 1, 1979
287.395 bln
+7.57 bln
2.71%
jan 1, 1980
346.46 bln
+59.066 bln
20.55%
jan 1, 1981
400.497 bln
+54.037 bln
15.6%
jan 1, 1982
429.803 bln
+29.306 bln
7.32%
jan 1, 1983
416.76 bln
-13.043 bln
-3.03%
jan 1, 1984
438.567 bln
+21.807 bln
5.23%
jan 1, 1985
448.081 bln
+9.514 bln
2.17%
jan 1, 1986
480.019 bln
+31.938 bln
7.13%
jan 1, 1987
506.771 bln
+26.752 bln
5.57%
jan 1, 1988
521.222 bln
+14.451 bln
2.85%
jan 1, 1989
582.103 bln
+60.881 bln
11.68%
jan 1, 1990
633.059 bln
+50.957 bln
8.75%
jan 1, 1991
693.865 bln
+60.806 bln
9.61%
jan 1, 1992
736.441 bln
+42.575 bln
6.14%
jan 1, 1993
734.306 bln
-2.135 bln
-0.29%
jan 1, 1994
767.481 bln
+33.176 bln
4.52%
jan 1, 1995
872.547 bln
+105.066 bln
13.69%
jan 1, 1996
960.89 bln
+88.343 bln
10.12%
jan 1, 1997
1.041 trl
+80.07 bln
8.33%
jan 1, 1998
1.111 trl
+69.836 bln
6.71%
jan 1, 1999
1.076 trl
-34.808 bln
-3.13%
jan 1, 2000
1.079 trl
+2.996 bln
0.28%
jan 1, 2001
1.181 trl
+102.256 bln
9.48%
jan 1, 2002
1.188 trl
+6.433 bln
0.54%
jan 1, 2003
1.217 trl
+29.646 bln
2.5%
jan 1, 2004
1.404 trl
+186.409 bln
15.31%
jan 1, 2005
1.648 trl
+244.454 bln
17.41%
jan 1, 2006
1.925 trl
+277.118 bln
16.81%
jan 1, 2007
2.293 trl
+367.397 bln
19.08%
jan 1, 2008
2.849 trl
+556.488 bln
24.27%
jan 1, 2009
3.421 trl
+572.05 bln
20.08%
jan 1, 2010
3.354 trl
-67.574 bln
-1.98%
jan 1, 2011
4.028 trl
+673.87 bln
20.09%
jan 1, 2012
4.726 trl
+698.893 bln
17.35%
jan 1, 2013
5.019 trl
+293.005 bln
6.2%
jan 1, 2014
5.29 trl
+270.937 bln
5.4%
Ranking of countries by current statistics by years


Comments: