29
/
en
AIzaSyAYiBZKx7MnpbEhh9jyipgxe19OcubqV5w
April 1, 2024
61807
Upper middle income
UMC
false
2
1
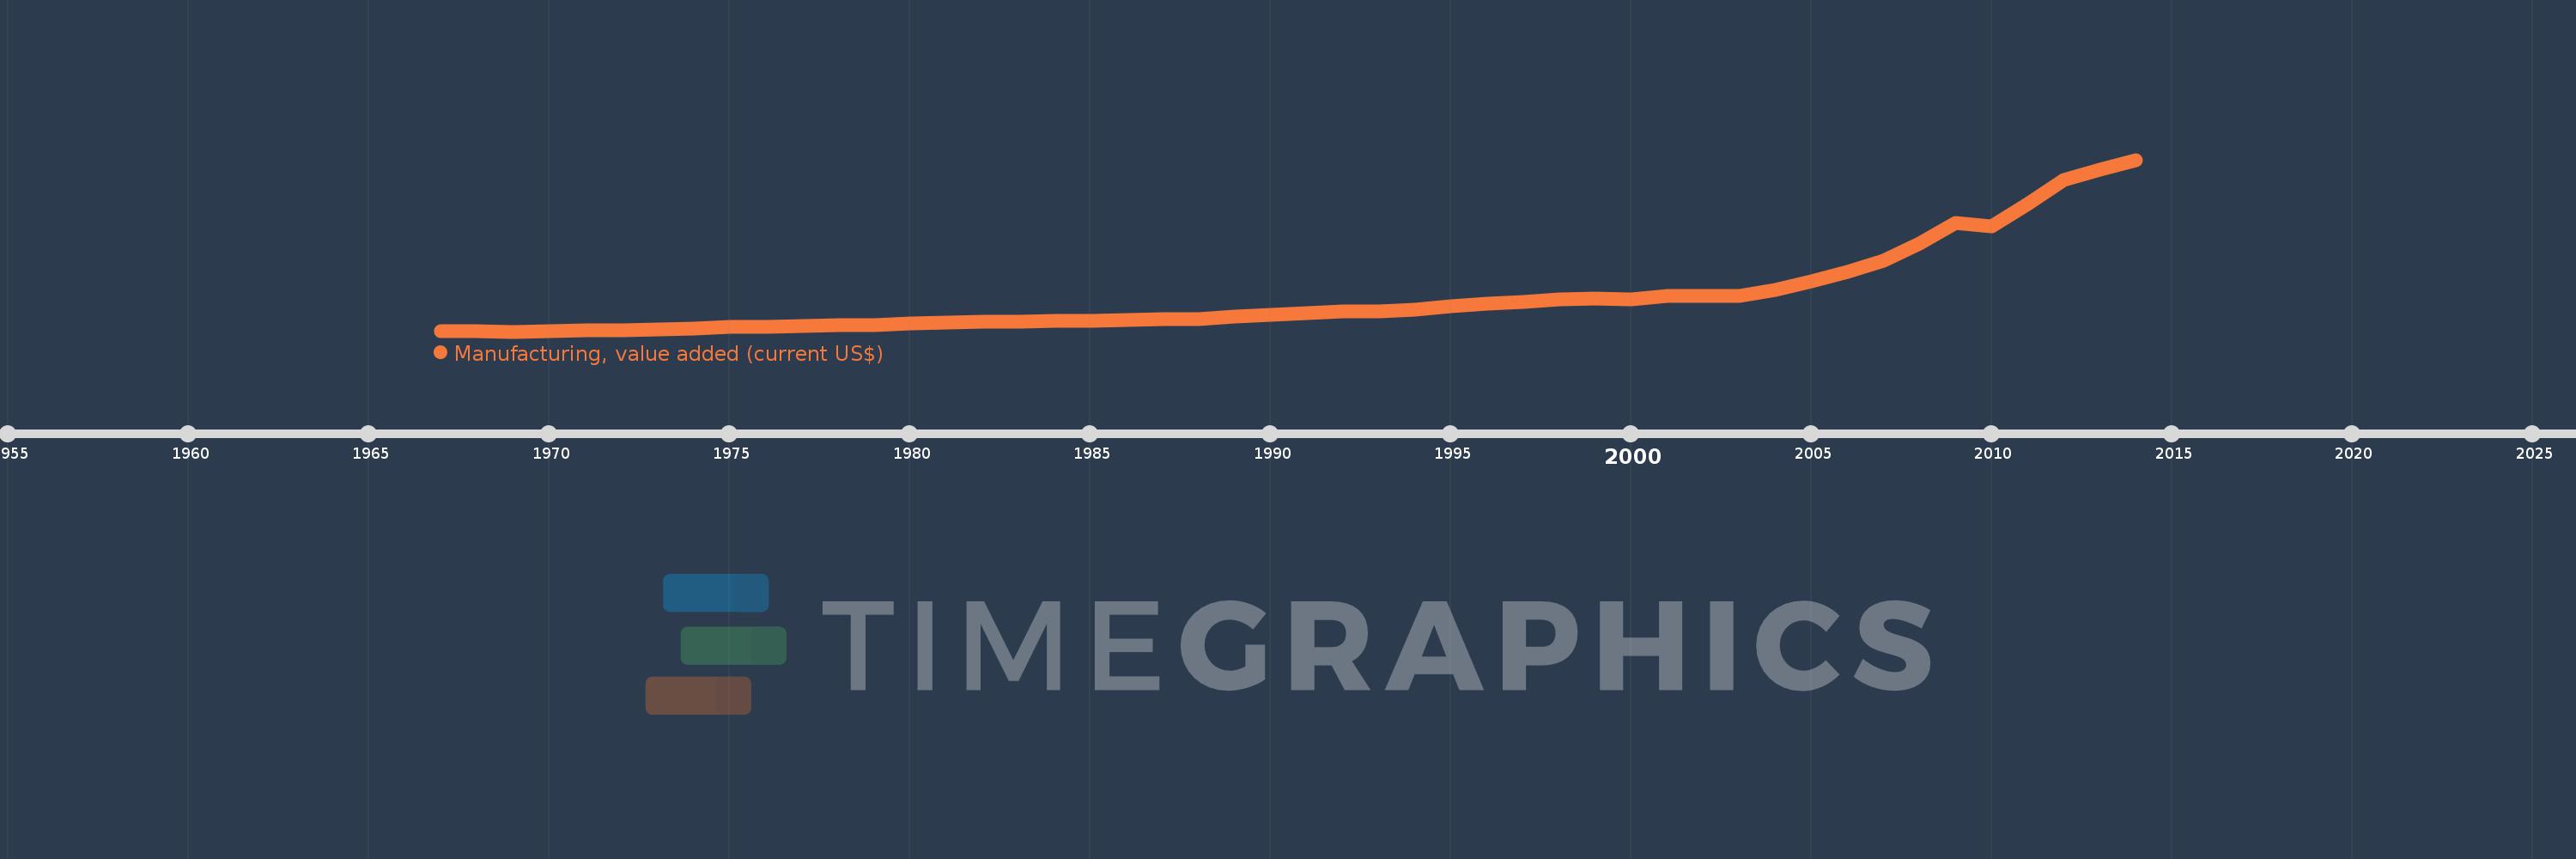
Manufacturing, value added (current US$)
2014,2013,2012,2011,2010,2009,2008,2007,2006,2005,2004,2003,2002,2001,2000,1999,1998,1997,1996,1995,1994,1993,1992,1991,1990,1989,1988,1987,1986,1985,1984,1983,1982,1981,1980,1979,1978,1977,1976,1975,1974,1973,1972,1971,1970,1969,1968,1967
This statistics in other country:
AfghanistanAlbaniaAlgeriaAndorraAngolaAntigua and BarbudaArab WorldArgentinaArmeniaArubaAustraliaAustriaAzerbaijanBahamas, TheBahrainBangladeshBarbadosBelarusBelgiumBelizeBeninBermudaBhutanBoliviaBosnia and HerzegovinaBotswanaBrazilBrunei DarussalamBurkina FasoBurundiCabo VerdeCambodiaCameroonCanadaCaribbean small statesCayman IslandsCentral African RepublicCentral Europe and the BalticsChadChileChinaColombiaComorosCongo, Dem. Rep.Congo, Rep.Costa RicaCote d'IvoireCroatiaCubaCyprusCzech RepublicDenmarkDjiboutiDominicaDominican RepublicEarly-demographic dividendEast Asia & PacificEast Asia & Pacific (excluding high income)East Asia & Pacific (IDA & IBRD countries)EcuadorEgypt, Arab Rep.El SalvadorEquatorial GuineaEritreaEstoniaEthiopiaEuro areaEurope & Central AsiaEurope & Central Asia (excluding high income)Europe & Central Asia (IDA & IBRD countries)European UnionFaroe IslandsFijiFinlandFragile and conflict affected situationsFranceGabonGambia, TheGeorgiaGermanyGhanaGreeceGrenadaGuatemalaGuineaGuinea-BissauGuyanaHeavily indebted poor countries (HIPC)High incomeHondurasHong Kong SAR, ChinaHungaryIBRD onlyIcelandIDA & IBRD totalIDA blendIDA onlyIDA totalIndiaIndonesiaIran, Islamic Rep.IraqIrelandItalyJamaicaJapanJordanKazakhstanKenyaKiribatiKorea, Rep.KosovoKuwaitKyrgyz RepublicLao PDRLate-demographic dividendLatin America & Caribbean Latin America & Caribbean (excluding high income)Latin America & the Caribbean (IDA & IBRD countries)LatviaLeast developed countries: UN classificationLebanonLesothoLiberiaLibyaLithuaniaLow & middle incomeLow incomeLower middle incomeLuxembourgMacao SAR, ChinaMacedonia, FYRMadagascarMalawiMalaysiaMaldivesMaliMaltaMarshall IslandsMauritaniaMauritiusMexicoMicronesia, Fed. Sts.Middle East & North AfricaMiddle East & North Africa (excluding high income)Middle East & North Africa (IDA & IBRD countries)Middle incomeMoldovaMongoliaMontenegroMoroccoMozambiqueMyanmarNamibiaNepalNetherlandsNew CaledoniaNew ZealandNicaraguaNigerNigeriaNorth AmericaNorwayOECD membersOmanOther small statesPacific island small statesPakistanPalauPanamaPapua New GuineaParaguayPeruPhilippinesPolandPortugalPost-demographic dividendPre-demographic dividendPuerto RicoQatarRomaniaRussian FederationRwandaSamoaSao Tome and PrincipeSaudi ArabiaSenegalSerbiaSeychellesSierra LeoneSingaporeSlovak RepublicSloveniaSmall statesSolomon IslandsSouth AfricaSouth AsiaSouth Asia (IDA & IBRD)SpainSri LankaSt. Kitts and NevisSt. LuciaSt. Vincent and the GrenadinesSub-Saharan Africa Sub-Saharan Africa (excluding high income)Sub-Saharan Africa (IDA & IBRD countries)SudanSurinameSwazilandSwedenSwitzerlandSyrian Arab RepublicTajikistanTanzaniaThailandTimor-LesteTogoTongaTrinidad and TobagoTunisiaTurkeyTurkmenistanTuvaluUgandaUkraineUnited Arab EmiratesUnited KingdomUnited StatesUpper middle incomeUruguayUzbekistanVanuatuVenezuela, RBVietnamWest Bank and GazaWorldYemen, Rep.ZambiaZimbabwe Timeline:
This timeline shows a graph from 1967 to 2014 of Upper middle income. No data until 1966. Number of actual observations by date: 48.
Source name:
World Development Indicators
Source organization:
World Bank national accounts data, and OECD National Accounts data files.
Categories, topics:
Economy & Growth
Last updated:
apr 23, 2017
Indicators value changes by year
Minimum:
54.221 bln
jan 1, 1969
Maximum:
4.409 trl
jan 1, 2014
At the date of observation
Value
Absolute change
Change from previous value
jan 1, 1967
58.413 bln
+58.413 bln
0.0%
jan 1, 1968
54.83 bln
-3.583 bln
-6.13%
jan 1, 1969
54.221 bln
-608.723 mln
-1.11%
jan 1, 1970
65.053 bln
+10.832 bln
19.98%
jan 1, 1971
79.893 bln
+14.84 bln
22.81%
jan 1, 1972
88.517 bln
+8.624 bln
10.79%
jan 1, 1973
106.856 bln
+18.34 bln
20.72%
jan 1, 1974
138.498 bln
+31.642 bln
29.61%
jan 1, 1975
163.905 bln
+25.407 bln
18.34%
jan 1, 1976
182.782 bln
+18.877 bln
11.52%
jan 1, 1977
188.132 bln
+5.35 bln
2.93%
jan 1, 1978
213.052 bln
+24.92 bln
13.25%
jan 1, 1979
210.698 bln
-2.354 bln
-1.1%
jan 1, 1980
257.642 bln
+46.944 bln
22.28%
jan 1, 1981
292.477 bln
+34.835 bln
13.52%
jan 1, 1982
315.493 bln
+23.016 bln
7.87%
jan 1, 1983
302.781 bln
-12.712 bln
-4.03%
jan 1, 1984
322.534 bln
+19.753 bln
6.52%
jan 1, 1985
330.446 bln
+7.913 bln
2.45%
jan 1, 1986
354.502 bln
+24.055 bln
7.28%
jan 1, 1987
373.723 bln
+19.222 bln
5.42%
jan 1, 1988
375.124 bln
+1.401 bln
0.37%
jan 1, 1989
424.497 bln
+49.373 bln
13.16%
jan 1, 1990
468.643 bln
+44.145 bln
10.4%
jan 1, 1991
516.741 bln
+48.099 bln
10.26%
jan 1, 1992
568.356 bln
+51.615 bln
9.99%
jan 1, 1993
557.038 bln
-11.318 bln
-1.99%
jan 1, 1994
599.817 bln
+42.779 bln
7.68%
jan 1, 1995
687.942 bln
+88.126 bln
14.69%
jan 1, 1996
753.444 bln
+65.501 bln
9.52%
jan 1, 1997
812.387 bln
+58.943 bln
7.82%
jan 1, 1998
880.367 bln
+67.98 bln
8.37%
jan 1, 1999
883.968 bln
+3.601 bln
0.41%
jan 1, 2000
867.131 bln
-16.837 bln
-1.9%
jan 1, 2001
954.477 bln
+87.347 bln
10.07%
jan 1, 2002
957.935 bln
+3.458 bln
0.36%
jan 1, 2003
966.596 bln
+8.661 bln
0.9%
jan 1, 2004
1.118 trl
+151.851 bln
15.71%
jan 1, 2005
1.324 trl
+205.112 bln
18.34%
jan 1, 2006
1.559 trl
+235.325 bln
17.78%
jan 1, 2007
1.857 trl
+298.058 bln
19.12%
jan 1, 2008
2.295 trl
+438.024 bln
23.59%
jan 1, 2009
2.805 trl
+510.262 bln
22.23%
jan 1, 2010
2.731 trl
-74.01 bln
-2.64%
jan 1, 2011
3.291 trl
+559.521 bln
20.49%
jan 1, 2012
3.894 trl
+603.349 bln
18.33%
jan 1, 2013
4.157 trl
+262.899 bln
6.75%
jan 1, 2014
4.409 trl
+251.872 bln
6.06%
Ranking of countries by current statistics by years


Comments: