29
/
en
AIzaSyAYiBZKx7MnpbEhh9jyipgxe19OcubqV5w
April 1, 2024
74146
Austria
AUT
true
2
1
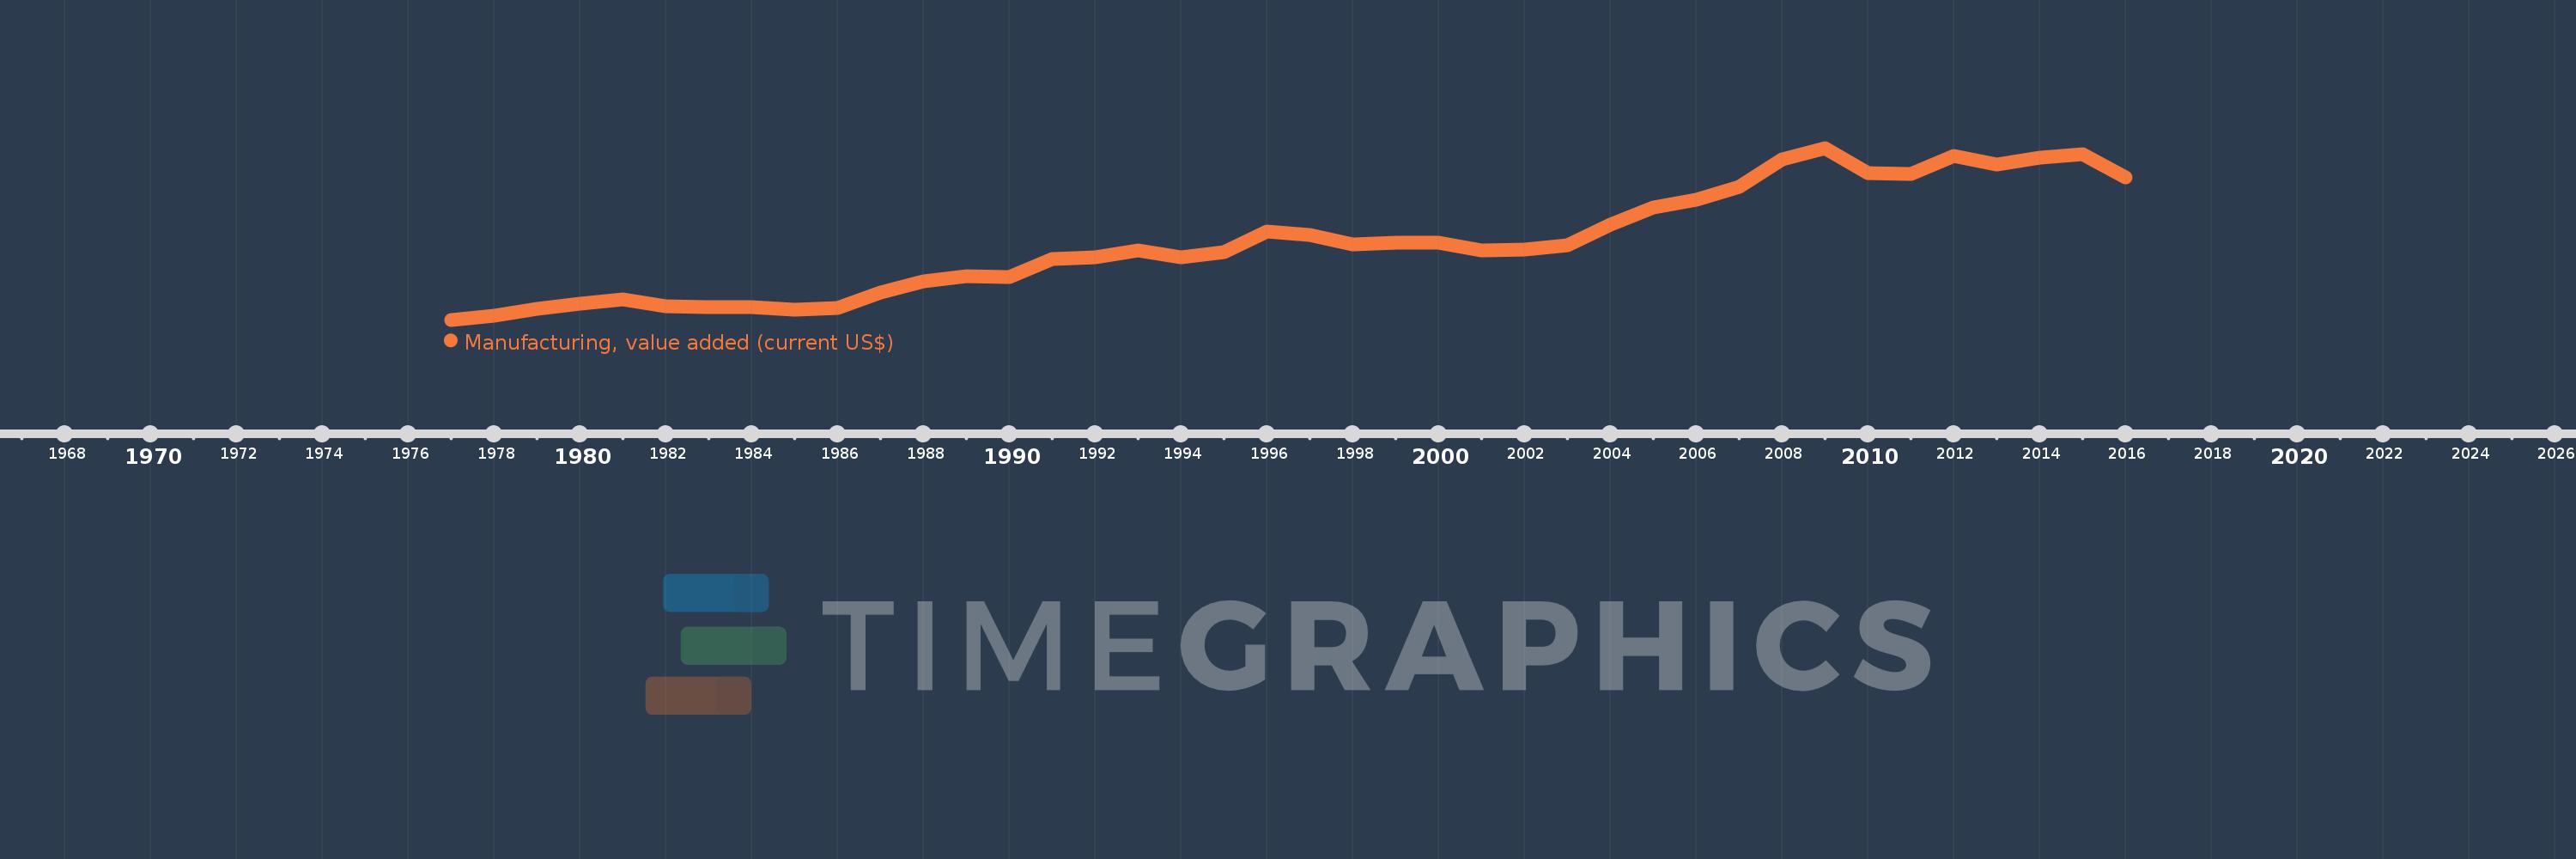
Manufacturing, value added (current US$)
2016,2015,2014,2013,2012,2011,2010,2009,2008,2007,2006,2005,2004,2003,2002,2001,2000,1999,1998,1997,1996,1995,1994,1993,1992,1991,1990,1989,1988,1987,1986,1985,1984,1983,1982,1981,1980,1979,1978,1977
This statistics in other country:
AfghanistanAlbaniaAlgeriaAndorraAngolaAntigua and BarbudaArab WorldArgentinaArmeniaArubaAustraliaAustriaAzerbaijanBahamas, TheBahrainBangladeshBarbadosBelarusBelgiumBelizeBeninBermudaBhutanBoliviaBosnia and HerzegovinaBotswanaBrazilBrunei DarussalamBurkina FasoBurundiCabo VerdeCambodiaCameroonCanadaCaribbean small statesCayman IslandsCentral African RepublicCentral Europe and the BalticsChadChileChinaColombiaComorosCongo, Dem. Rep.Congo, Rep.Costa RicaCote d'IvoireCroatiaCubaCyprusCzech RepublicDenmarkDjiboutiDominicaDominican RepublicEarly-demographic dividendEast Asia & PacificEast Asia & Pacific (excluding high income)East Asia & Pacific (IDA & IBRD countries)EcuadorEgypt, Arab Rep.El SalvadorEquatorial GuineaEritreaEstoniaEthiopiaEuro areaEurope & Central AsiaEurope & Central Asia (excluding high income)Europe & Central Asia (IDA & IBRD countries)European UnionFaroe IslandsFijiFinlandFragile and conflict affected situationsFranceGabonGambia, TheGeorgiaGermanyGhanaGreeceGrenadaGuatemalaGuineaGuinea-BissauGuyanaHeavily indebted poor countries (HIPC)High incomeHondurasHong Kong SAR, ChinaHungaryIBRD onlyIcelandIDA & IBRD totalIDA blendIDA onlyIDA totalIndiaIndonesiaIran, Islamic Rep.IraqIrelandItalyJamaicaJapanJordanKazakhstanKenyaKiribatiKorea, Rep.KosovoKuwaitKyrgyz RepublicLao PDRLate-demographic dividendLatin America & Caribbean Latin America & Caribbean (excluding high income)Latin America & the Caribbean (IDA & IBRD countries)LatviaLeast developed countries: UN classificationLebanonLesothoLiberiaLibyaLithuaniaLow & middle incomeLow incomeLower middle incomeLuxembourgMacao SAR, ChinaMacedonia, FYRMadagascarMalawiMalaysiaMaldivesMaliMaltaMarshall IslandsMauritaniaMauritiusMexicoMicronesia, Fed. Sts.Middle East & North AfricaMiddle East & North Africa (excluding high income)Middle East & North Africa (IDA & IBRD countries)Middle incomeMoldovaMongoliaMontenegroMoroccoMozambiqueMyanmarNamibiaNepalNetherlandsNew CaledoniaNew ZealandNicaraguaNigerNigeriaNorth AmericaNorwayOECD membersOmanOther small statesPacific island small statesPakistanPalauPanamaPapua New GuineaParaguayPeruPhilippinesPolandPortugalPost-demographic dividendPre-demographic dividendPuerto RicoQatarRomaniaRussian FederationRwandaSamoaSao Tome and PrincipeSaudi ArabiaSenegalSerbiaSeychellesSierra LeoneSingaporeSlovak RepublicSloveniaSmall statesSolomon IslandsSouth AfricaSouth AsiaSouth Asia (IDA & IBRD)SpainSri LankaSt. Kitts and NevisSt. LuciaSt. Vincent and the GrenadinesSub-Saharan Africa Sub-Saharan Africa (excluding high income)Sub-Saharan Africa (IDA & IBRD countries)SudanSurinameSwazilandSwedenSwitzerlandSyrian Arab RepublicTajikistanTanzaniaThailandTimor-LesteTogoTongaTrinidad and TobagoTunisiaTurkeyTurkmenistanTuvaluUgandaUkraineUnited Arab EmiratesUnited KingdomUnited StatesUpper middle incomeUruguayUzbekistanVanuatuVenezuela, RBVietnamWest Bank and GazaWorldYemen, Rep.ZambiaZimbabwe Timeline:
This timeline shows a graph from 1977 to 2016 of Austria. No data until 1976. Number of actual observations by date: 40.
Source name:
World Development Indicators
Source organization:
World Bank national accounts data, and OECD National Accounts data files.
Categories, topics:
Economy & Growth
Last updated:
apr 23, 2017
Indicators value changes by year
Minimum:
9.553 bln
jan 1, 1977
Maximum:
74.779 bln
jan 1, 2009
At the date of observation
Value
Absolute change
Change from previous value
jan 1, 1977
9.553 bln
+9.553 bln
0.0%
jan 1, 1978
11.14 bln
+1.587 bln
16.61%
jan 1, 1979
13.635 bln
+2.495 bln
22.4%
jan 1, 1980
15.777 bln
+2.141 bln
15.7%
jan 1, 1981
17.388 bln
+1.611 bln
10.21%
jan 1, 1982
14.732 bln
-2.655 bln
-15.27%
jan 1, 1983
14.343 bln
-389.116 mln
-2.64%
jan 1, 1984
14.458 bln
+114.83 mln
0.8%
jan 1, 1985
13.381 bln
-1.078 bln
-7.45%
jan 1, 1986
13.88 bln
+499.525 mln
3.73%
jan 1, 1987
19.803 bln
+5.922 bln
42.67%
jan 1, 1988
24.087 bln
+4.284 bln
21.64%
jan 1, 1989
25.991 bln
+1.904 bln
7.9%
jan 1, 1990
25.811 bln
-179.847 mln
-0.69%
jan 1, 1991
32.574 bln
+6.763 bln
26.2%
jan 1, 1992
33.297 bln
+723.499 mln
2.22%
jan 1, 1993
36.026 bln
+2.729 bln
8.19%
jan 1, 1994
33.219 bln
-2.807 bln
-7.79%
jan 1, 1995
35.303 bln
+2.085 bln
6.28%
jan 1, 1996
43.131 bln
+7.828 bln
22.17%
jan 1, 1997
41.806 bln
-1.325 bln
-3.07%
jan 1, 1998
38.018 bln
-3.788 bln
-9.06%
jan 1, 1999
38.759 bln
+740.754 mln
1.95%
jan 1, 2000
38.929 bln
+170.65 mln
0.44%
jan 1, 2001
35.953 bln
-2.977 bln
-7.65%
jan 1, 2002
36.338 bln
+384.939 mln
1.07%
jan 1, 2003
37.914 bln
+1.576 bln
4.34%
jan 1, 2004
45.736 bln
+7.822 bln
20.63%
jan 1, 2005
52.24 bln
+6.504 bln
14.22%
jan 1, 2006
55.042 bln
+2.802 bln
5.36%
jan 1, 2007
59.845 bln
+4.803 bln
8.73%
jan 1, 2008
70.523 bln
+10.678 bln
17.84%
jan 1, 2009
74.779 bln
+4.256 bln
6.04%
jan 1, 2010
65.344 bln
-9.435 bln
-12.62%
jan 1, 2011
64.878 bln
-465.539 mln
-0.71%
jan 1, 2012
71.7 bln
+6.821 bln
10.51%
jan 1, 2013
68.589 bln
-3.111 bln
-4.34%
jan 1, 2014
71.106 bln
+2.517 bln
3.67%
jan 1, 2015
72.415 bln
+1.309 bln
1.84%
jan 1, 2016
63.459 bln
-8.956 bln
-12.37%
Ranking of countries by current statistics by years


Comments: