29
/
en
AIzaSyAYiBZKx7MnpbEhh9jyipgxe19OcubqV5w
April 1, 2024
213224
Nigeria
NGA
true
2
1
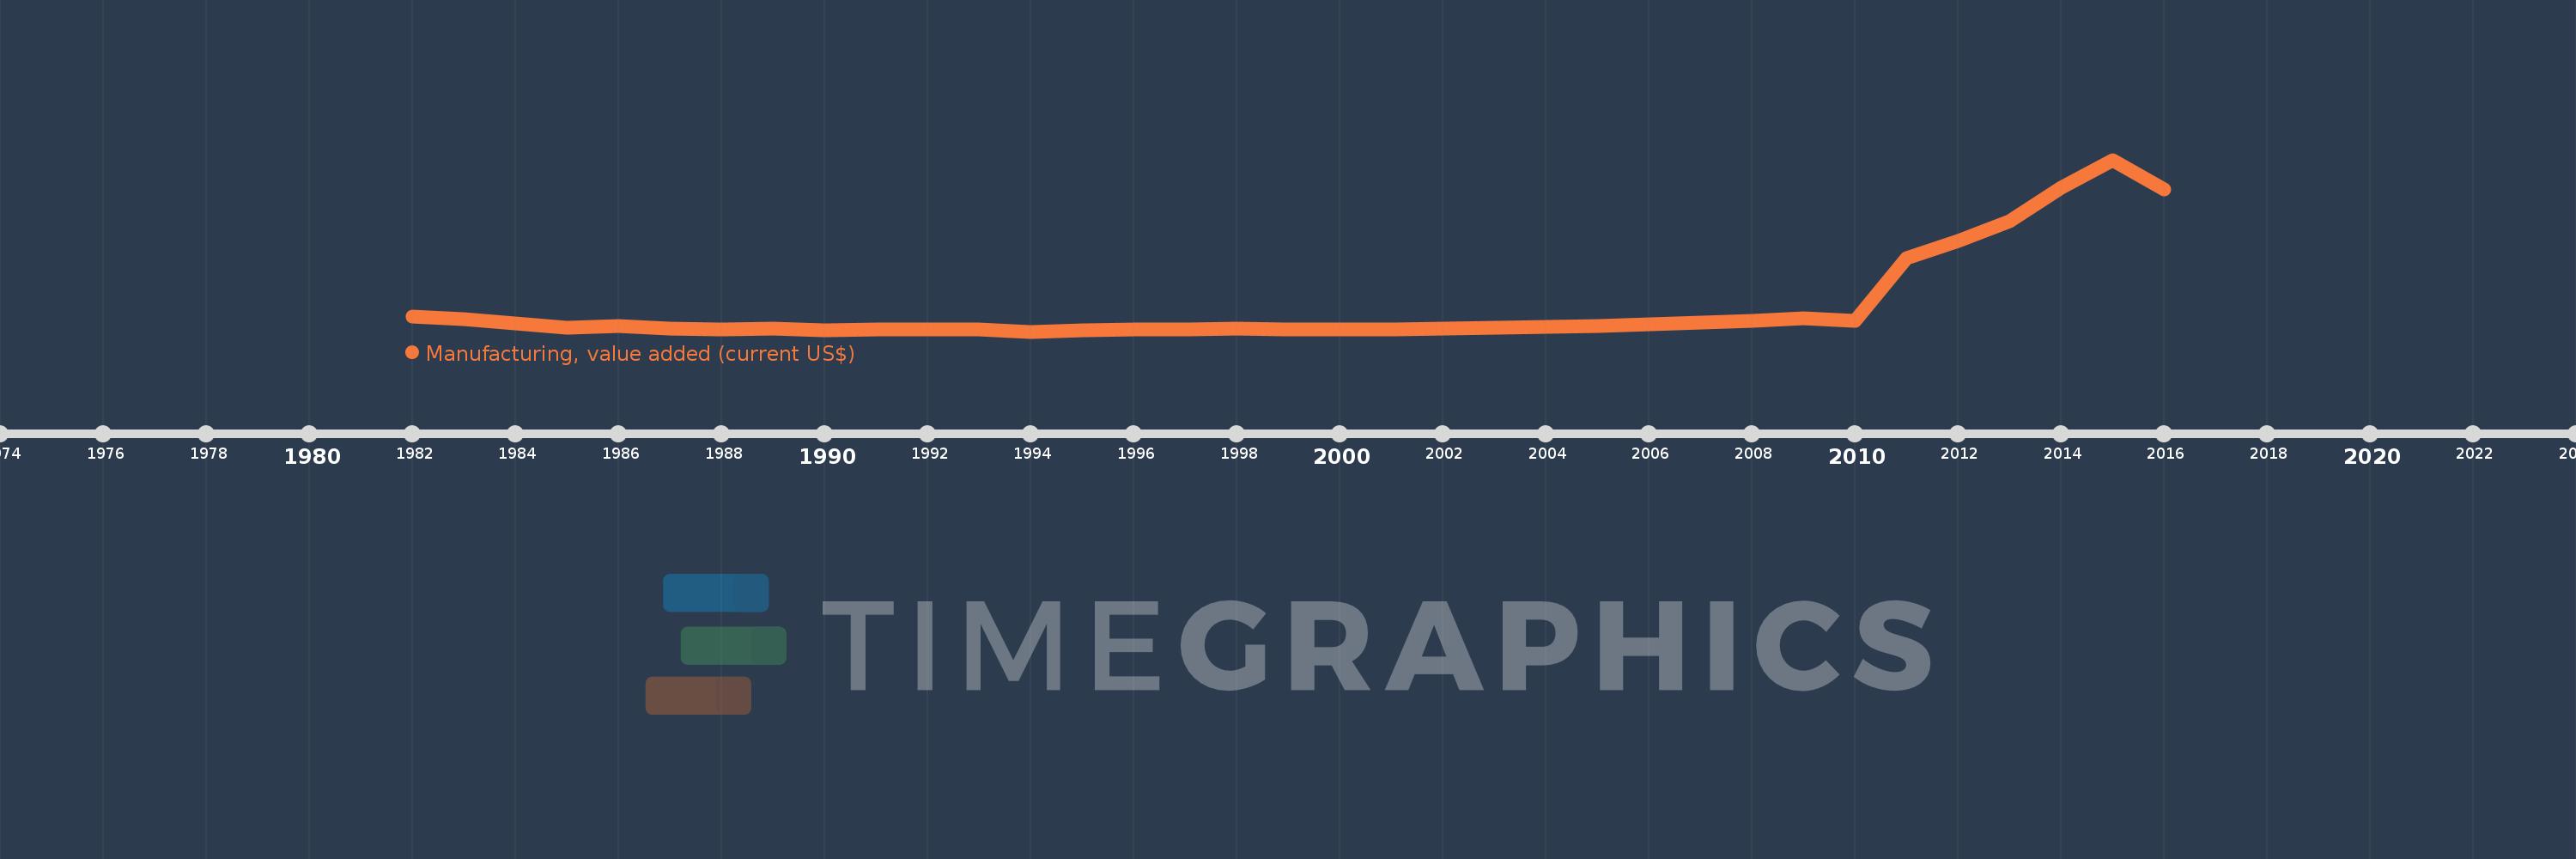
Manufacturing, value added (current US$)
2016,2015,2014,2013,2012,2011,2010,2009,2008,2007,2006,2005,2004,2003,2002,2001,2000,1999,1998,1997,1996,1995,1994,1993,1992,1991,1990,1989,1988,1987,1986,1985,1984,1983,1982
This statistics in other country:
AfghanistanAlbaniaAlgeriaAndorraAngolaAntigua and BarbudaArab WorldArgentinaArmeniaArubaAustraliaAustriaAzerbaijanBahamas, TheBahrainBangladeshBarbadosBelarusBelgiumBelizeBeninBermudaBhutanBoliviaBosnia and HerzegovinaBotswanaBrazilBrunei DarussalamBurkina FasoBurundiCabo VerdeCambodiaCameroonCanadaCaribbean small statesCayman IslandsCentral African RepublicCentral Europe and the BalticsChadChileChinaColombiaComorosCongo, Dem. Rep.Congo, Rep.Costa RicaCote d'IvoireCroatiaCubaCyprusCzech RepublicDenmarkDjiboutiDominicaDominican RepublicEarly-demographic dividendEast Asia & PacificEast Asia & Pacific (excluding high income)East Asia & Pacific (IDA & IBRD countries)EcuadorEgypt, Arab Rep.El SalvadorEquatorial GuineaEritreaEstoniaEthiopiaEuro areaEurope & Central AsiaEurope & Central Asia (excluding high income)Europe & Central Asia (IDA & IBRD countries)European UnionFaroe IslandsFijiFinlandFragile and conflict affected situationsFranceGabonGambia, TheGeorgiaGermanyGhanaGreeceGrenadaGuatemalaGuineaGuinea-BissauGuyanaHeavily indebted poor countries (HIPC)High incomeHondurasHong Kong SAR, ChinaHungaryIBRD onlyIcelandIDA & IBRD totalIDA blendIDA onlyIDA totalIndiaIndonesiaIran, Islamic Rep.IraqIrelandItalyJamaicaJapanJordanKazakhstanKenyaKiribatiKorea, Rep.KosovoKuwaitKyrgyz RepublicLao PDRLate-demographic dividendLatin America & Caribbean Latin America & Caribbean (excluding high income)Latin America & the Caribbean (IDA & IBRD countries)LatviaLeast developed countries: UN classificationLebanonLesothoLiberiaLibyaLithuaniaLow & middle incomeLow incomeLower middle incomeLuxembourgMacao SAR, ChinaMacedonia, FYRMadagascarMalawiMalaysiaMaldivesMaliMaltaMarshall IslandsMauritaniaMauritiusMexicoMicronesia, Fed. Sts.Middle East & North AfricaMiddle East & North Africa (excluding high income)Middle East & North Africa (IDA & IBRD countries)Middle incomeMoldovaMongoliaMontenegroMoroccoMozambiqueMyanmarNamibiaNepalNetherlandsNew CaledoniaNew ZealandNicaraguaNigerNigeriaNorth AmericaNorwayOECD membersOmanOther small statesPacific island small statesPakistanPalauPanamaPapua New GuineaParaguayPeruPhilippinesPolandPortugalPost-demographic dividendPre-demographic dividendPuerto RicoQatarRomaniaRussian FederationRwandaSamoaSao Tome and PrincipeSaudi ArabiaSenegalSerbiaSeychellesSierra LeoneSingaporeSlovak RepublicSloveniaSmall statesSolomon IslandsSouth AfricaSouth AsiaSouth Asia (IDA & IBRD)SpainSri LankaSt. Kitts and NevisSt. LuciaSt. Vincent and the GrenadinesSub-Saharan Africa Sub-Saharan Africa (excluding high income)Sub-Saharan Africa (IDA & IBRD countries)SudanSurinameSwazilandSwedenSwitzerlandSyrian Arab RepublicTajikistanTanzaniaThailandTimor-LesteTogoTongaTrinidad and TobagoTunisiaTurkeyTurkmenistanTuvaluUgandaUkraineUnited Arab EmiratesUnited KingdomUnited StatesUpper middle incomeUruguayUzbekistanVanuatuVenezuela, RBVietnamWest Bank and GazaWorldYemen, Rep.ZambiaZimbabwe Timeline:
This timeline shows a graph from 1982 to 2016 of Nigeria. No data until 1981. Number of actual observations by date: 35.
Source name:
World Development Indicators
Source organization:
World Bank national accounts data, and OECD National Accounts data files.
Categories, topics:
Economy & Growth
Last updated:
apr 23, 2017
Indicators value changes by year
Minimum:
860.643 mln
jan 1, 1994
Maximum:
54.779 bln
jan 1, 2015
At the date of observation
Value
Absolute change
Change from previous value
jan 1, 1982
5.549 bln
+5.549 bln
0.0%
jan 1, 1983
4.835 bln
-714.062 mln
-12.87%
jan 1, 1984
3.39 bln
-1.445 bln
-29.88%
jan 1, 1985
2.148 bln
-1.242 bln
-36.65%
jan 1, 1986
2.522 bln
+373.882 mln
17.41%
jan 1, 1987
1.823 bln
-698.379 mln
-27.7%
jan 1, 1988
1.608 bln
-215.423 mln
-11.82%
jan 1, 1989
1.733 bln
+125.326 mln
7.79%
jan 1, 1990
1.323 bln
-409.933 mln
-23.65%
jan 1, 1991
1.606 bln
+282.877 mln
21.38%
jan 1, 1992
1.611 bln
+5.137 mln
0.32%
jan 1, 1993
1.425 bln
-186.736 mln
-11.59%
jan 1, 1994
860.643 mln
-563.875 mln
-39.58%
jan 1, 1995
1.203 bln
+342.45 mln
39.79%
jan 1, 1996
1.496 bln
+293.348 mln
24.38%
jan 1, 1997
1.661 bln
+164.772 mln
11.01%
jan 1, 1998
1.776 bln
+114.815 mln
6.91%
jan 1, 1999
1.608 bln
-168.114 mln
-9.47%
jan 1, 2000
1.635 bln
+26.801 mln
1.67%
jan 1, 2001
1.652 bln
+17.609 mln
1.08%
jan 1, 2002
1.79 bln
+137.454 mln
8.32%
jan 1, 2003
1.964 bln
+174.304 mln
9.74%
jan 1, 2004
2.227 bln
+262.617 mln
13.37%
jan 1, 2005
2.629 bln
+401.952 mln
18.05%
jan 1, 2006
3.144 bln
+515.197 mln
19.6%
jan 1, 2007
3.72 bln
+575.684 mln
18.31%
jan 1, 2008
4.14 bln
+420.766 mln
11.31%
jan 1, 2009
4.94 bln
+799.329 mln
19.31%
jan 1, 2010
4.112 bln
-827.459 mln
-16.75%
jan 1, 2011
23.81 bln
+19.698 bln
479.02%
jan 1, 2012
29.258 bln
+5.448 bln
22.88%
jan 1, 2013
35.485 bln
+6.227 bln
21.28%
jan 1, 2014
45.981 bln
+10.496 bln
29.58%
jan 1, 2015
54.779 bln
+8.799 bln
19.14%
jan 1, 2016
45.357 bln
-9.422 bln
-17.2%
Ranking of countries by current statistics by years


Comments: