29
/
en
AIzaSyAYiBZKx7MnpbEhh9jyipgxe19OcubqV5w
April 1, 2024
92784
Brunei Darussalam
BRN
true
2
1
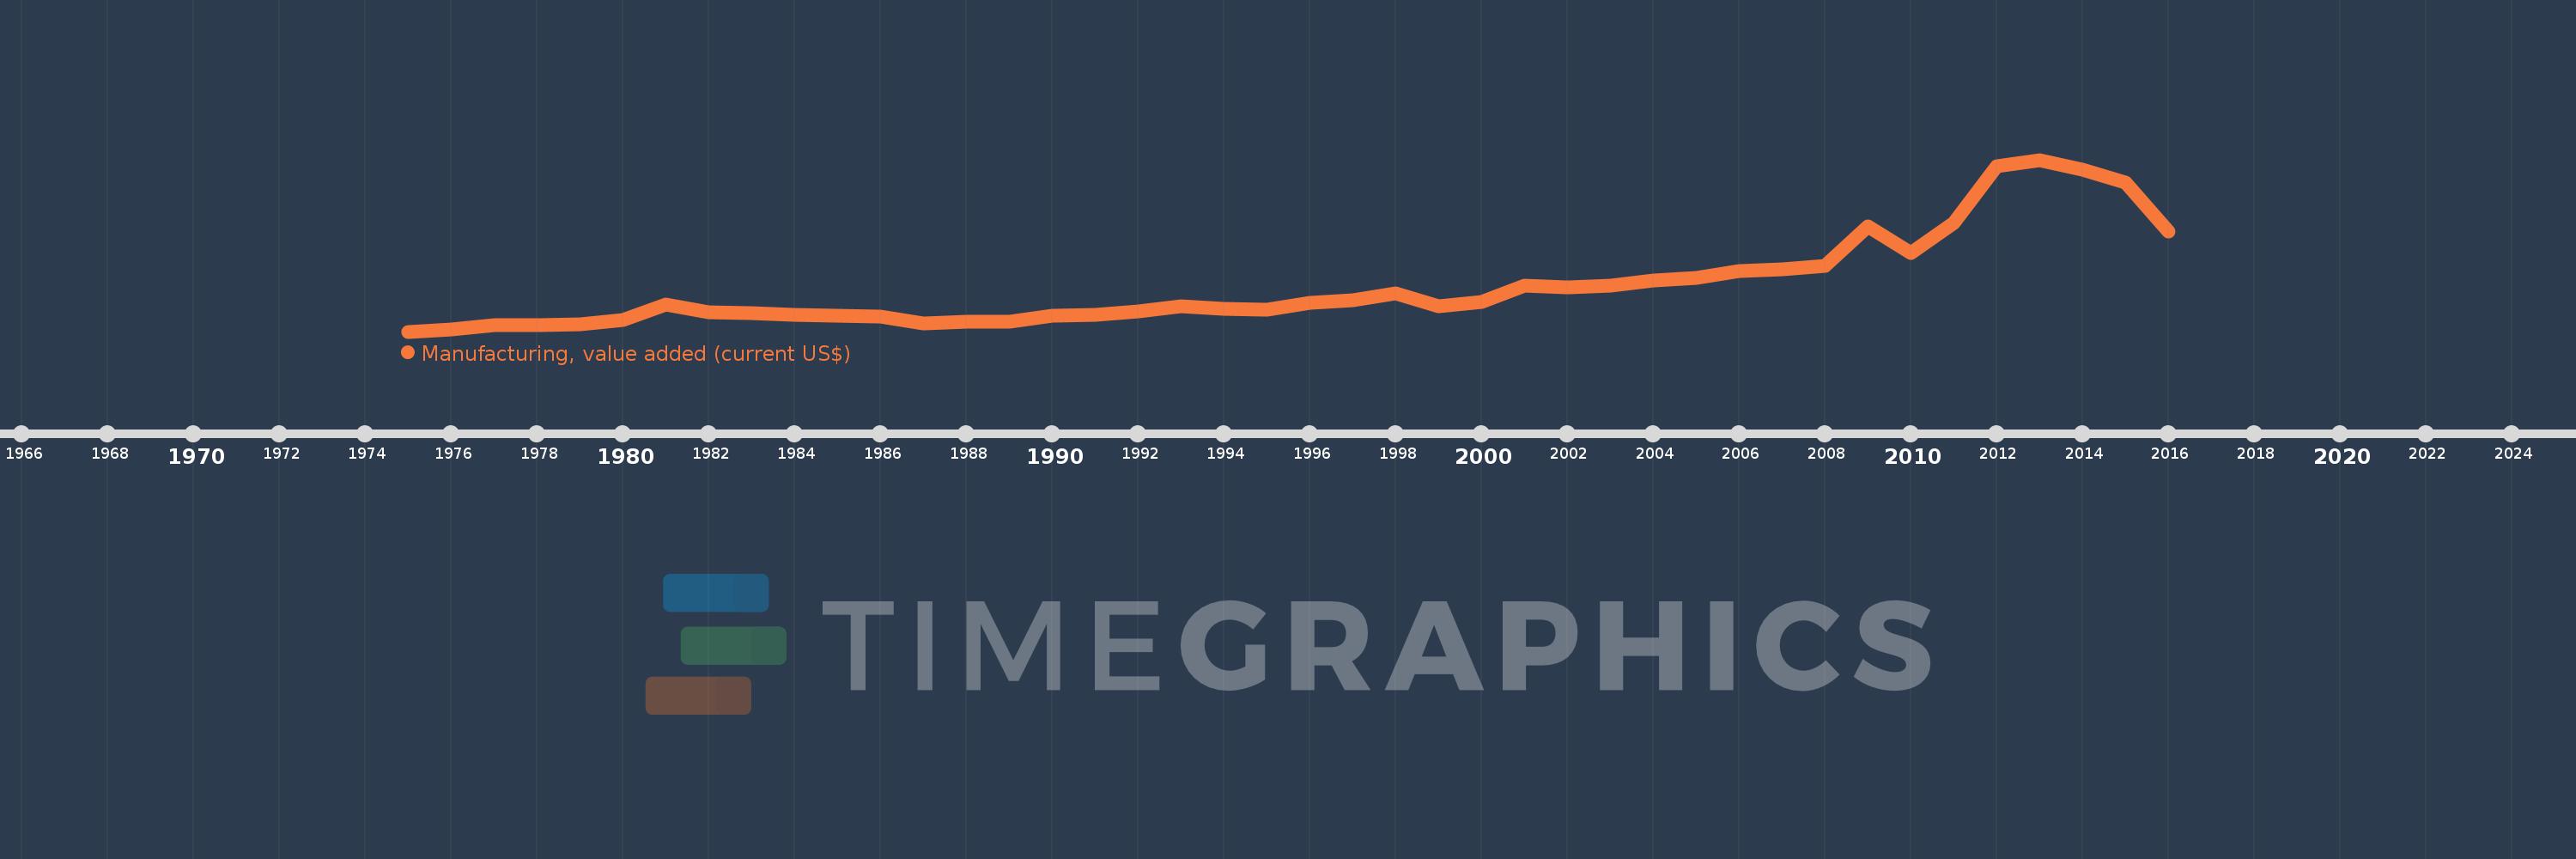
Manufacturing, value added (current US$)
2016,2015,2014,2013,2012,2011,2010,2009,2008,2007,2006,2005,2004,2003,2002,2001,2000,1999,1998,1997,1996,1995,1994,1993,1992,1991,1990,1989,1988,1987,1986,1985,1984,1983,1982,1981,1980,1979,1978,1977,1976,1975
This statistics in other country:
AfghanistanAlbaniaAlgeriaAndorraAngolaAntigua and BarbudaArab WorldArgentinaArmeniaArubaAustraliaAustriaAzerbaijanBahamas, TheBahrainBangladeshBarbadosBelarusBelgiumBelizeBeninBermudaBhutanBoliviaBosnia and HerzegovinaBotswanaBrazilBrunei DarussalamBurkina FasoBurundiCabo VerdeCambodiaCameroonCanadaCaribbean small statesCayman IslandsCentral African RepublicCentral Europe and the BalticsChadChileChinaColombiaComorosCongo, Dem. Rep.Congo, Rep.Costa RicaCote d'IvoireCroatiaCubaCyprusCzech RepublicDenmarkDjiboutiDominicaDominican RepublicEarly-demographic dividendEast Asia & PacificEast Asia & Pacific (excluding high income)East Asia & Pacific (IDA & IBRD countries)EcuadorEgypt, Arab Rep.El SalvadorEquatorial GuineaEritreaEstoniaEthiopiaEuro areaEurope & Central AsiaEurope & Central Asia (excluding high income)Europe & Central Asia (IDA & IBRD countries)European UnionFaroe IslandsFijiFinlandFragile and conflict affected situationsFranceGabonGambia, TheGeorgiaGermanyGhanaGreeceGrenadaGuatemalaGuineaGuinea-BissauGuyanaHeavily indebted poor countries (HIPC)High incomeHondurasHong Kong SAR, ChinaHungaryIBRD onlyIcelandIDA & IBRD totalIDA blendIDA onlyIDA totalIndiaIndonesiaIran, Islamic Rep.IraqIrelandItalyJamaicaJapanJordanKazakhstanKenyaKiribatiKorea, Rep.KosovoKuwaitKyrgyz RepublicLao PDRLate-demographic dividendLatin America & Caribbean Latin America & Caribbean (excluding high income)Latin America & the Caribbean (IDA & IBRD countries)LatviaLeast developed countries: UN classificationLebanonLesothoLiberiaLibyaLithuaniaLow & middle incomeLow incomeLower middle incomeLuxembourgMacao SAR, ChinaMacedonia, FYRMadagascarMalawiMalaysiaMaldivesMaliMaltaMarshall IslandsMauritaniaMauritiusMexicoMicronesia, Fed. Sts.Middle East & North AfricaMiddle East & North Africa (excluding high income)Middle East & North Africa (IDA & IBRD countries)Middle incomeMoldovaMongoliaMontenegroMoroccoMozambiqueMyanmarNamibiaNepalNetherlandsNew CaledoniaNew ZealandNicaraguaNigerNigeriaNorth AmericaNorwayOECD membersOmanOther small statesPacific island small statesPakistanPalauPanamaPapua New GuineaParaguayPeruPhilippinesPolandPortugalPost-demographic dividendPre-demographic dividendPuerto RicoQatarRomaniaRussian FederationRwandaSamoaSao Tome and PrincipeSaudi ArabiaSenegalSerbiaSeychellesSierra LeoneSingaporeSlovak RepublicSloveniaSmall statesSolomon IslandsSouth AfricaSouth AsiaSouth Asia (IDA & IBRD)SpainSri LankaSt. Kitts and NevisSt. LuciaSt. Vincent and the GrenadinesSub-Saharan Africa Sub-Saharan Africa (excluding high income)Sub-Saharan Africa (IDA & IBRD countries)SudanSurinameSwazilandSwedenSwitzerlandSyrian Arab RepublicTajikistanTanzaniaThailandTimor-LesteTogoTongaTrinidad and TobagoTunisiaTurkeyTurkmenistanTuvaluUgandaUkraineUnited Arab EmiratesUnited KingdomUnited StatesUpper middle incomeUruguayUzbekistanVanuatuVenezuela, RBVietnamWest Bank and GazaWorldYemen, Rep.ZambiaZimbabwe Timeline:
This timeline shows a graph from 1975 to 2016 of Brunei Darussalam. No data until 1974. Number of actual observations by date: 42.
Source name:
World Development Indicators
Source organization:
World Bank national accounts data, and OECD National Accounts data files.
Categories, topics:
Economy & Growth
Last updated:
apr 23, 2017
Indicators value changes by year
Minimum:
93.151 mln
jan 1, 1975
Maximum:
3.167 bln
jan 1, 2013
At the date of observation
Value
Absolute change
Change from previous value
jan 1, 1975
93.151 mln
+93.151 mln
0.0%
jan 1, 1976
136.634 mln
+43.483 mln
46.68%
jan 1, 1977
201.554 mln
+64.92 mln
47.51%
jan 1, 1978
207.428 mln
+5.874 mln
2.91%
jan 1, 1979
231.31 mln
+23.882 mln
11.51%
jan 1, 1980
300.285 mln
+68.975 mln
29.82%
jan 1, 1981
582.384 mln
+282.099 mln
93.94%
jan 1, 1982
433.568 mln
-148.815 mln
-25.55%
jan 1, 1983
422.43 mln
-11.139 mln
-2.57%
jan 1, 1984
386.181 mln
-36.249 mln
-8.58%
jan 1, 1985
383.011 mln
-3.17 mln
-0.82%
jan 1, 1986
356.347 mln
-26.663 mln
-6.96%
jan 1, 1987
244.787 mln
-111.56 mln
-31.31%
jan 1, 1988
276.828 mln
+32.041 mln
13.09%
jan 1, 1989
271.815 mln
-5.013 mln
-1.81%
jan 1, 1990
370.999 mln
+99.185 mln
36.49%
jan 1, 1991
392.018 mln
+21.018 mln
5.67%
jan 1, 1992
461.462 mln
+69.444 mln
17.71%
jan 1, 1993
539.483 mln
+78.022 mln
16.91%
jan 1, 1994
503.887 mln
-35.597 mln
-6.6%
jan 1, 1995
491.125 mln
-12.762 mln
-2.53%
jan 1, 1996
615.612 mln
+124.487 mln
25.35%
jan 1, 1997
652.785 mln
+37.173 mln
6.04%
jan 1, 1998
779.549 mln
+126.764 mln
19.42%
jan 1, 1999
553.554 mln
-225.994 mln
-28.99%
jan 1, 2000
623.151 mln
+69.597 mln
12.57%
jan 1, 2001
921.964 mln
+298.813 mln
47.95%
jan 1, 2002
880.803 mln
-41.161 mln
-4.46%
jan 1, 2003
916.476 mln
+35.672 mln
4.05%
jan 1, 2004
1.004 bln
+87.828 mln
9.58%
jan 1, 2005
1.046 bln
+41.723 mln
4.15%
jan 1, 2006
1.173 bln
+127.061 mln
12.15%
jan 1, 2007
1.212 bln
+38.631 mln
3.29%
jan 1, 2008
1.271 bln
+59.73 mln
4.93%
jan 1, 2009
1.973 bln
+701.526 mln
55.18%
jan 1, 2010
1.499 bln
-473.731 mln
-24.01%
jan 1, 2011
2.043 bln
+544.027 mln
36.29%
jan 1, 2012
3.045 bln
+1.001 bln
49.01%
jan 1, 2013
3.167 bln
+121.856 mln
4.0%
jan 1, 2014
2.985 bln
-181.479 mln
-5.73%
jan 1, 2015
2.758 bln
-227.439 mln
-7.62%
jan 1, 2016
1.879 bln
-879.013 mln
-31.87%
Ranking of countries by current statistics by years


Comments: