29
/
en
AIzaSyAYiBZKx7MnpbEhh9jyipgxe19OcubqV5w
April 1, 2024
107526
Colombia
COL
true
2
1
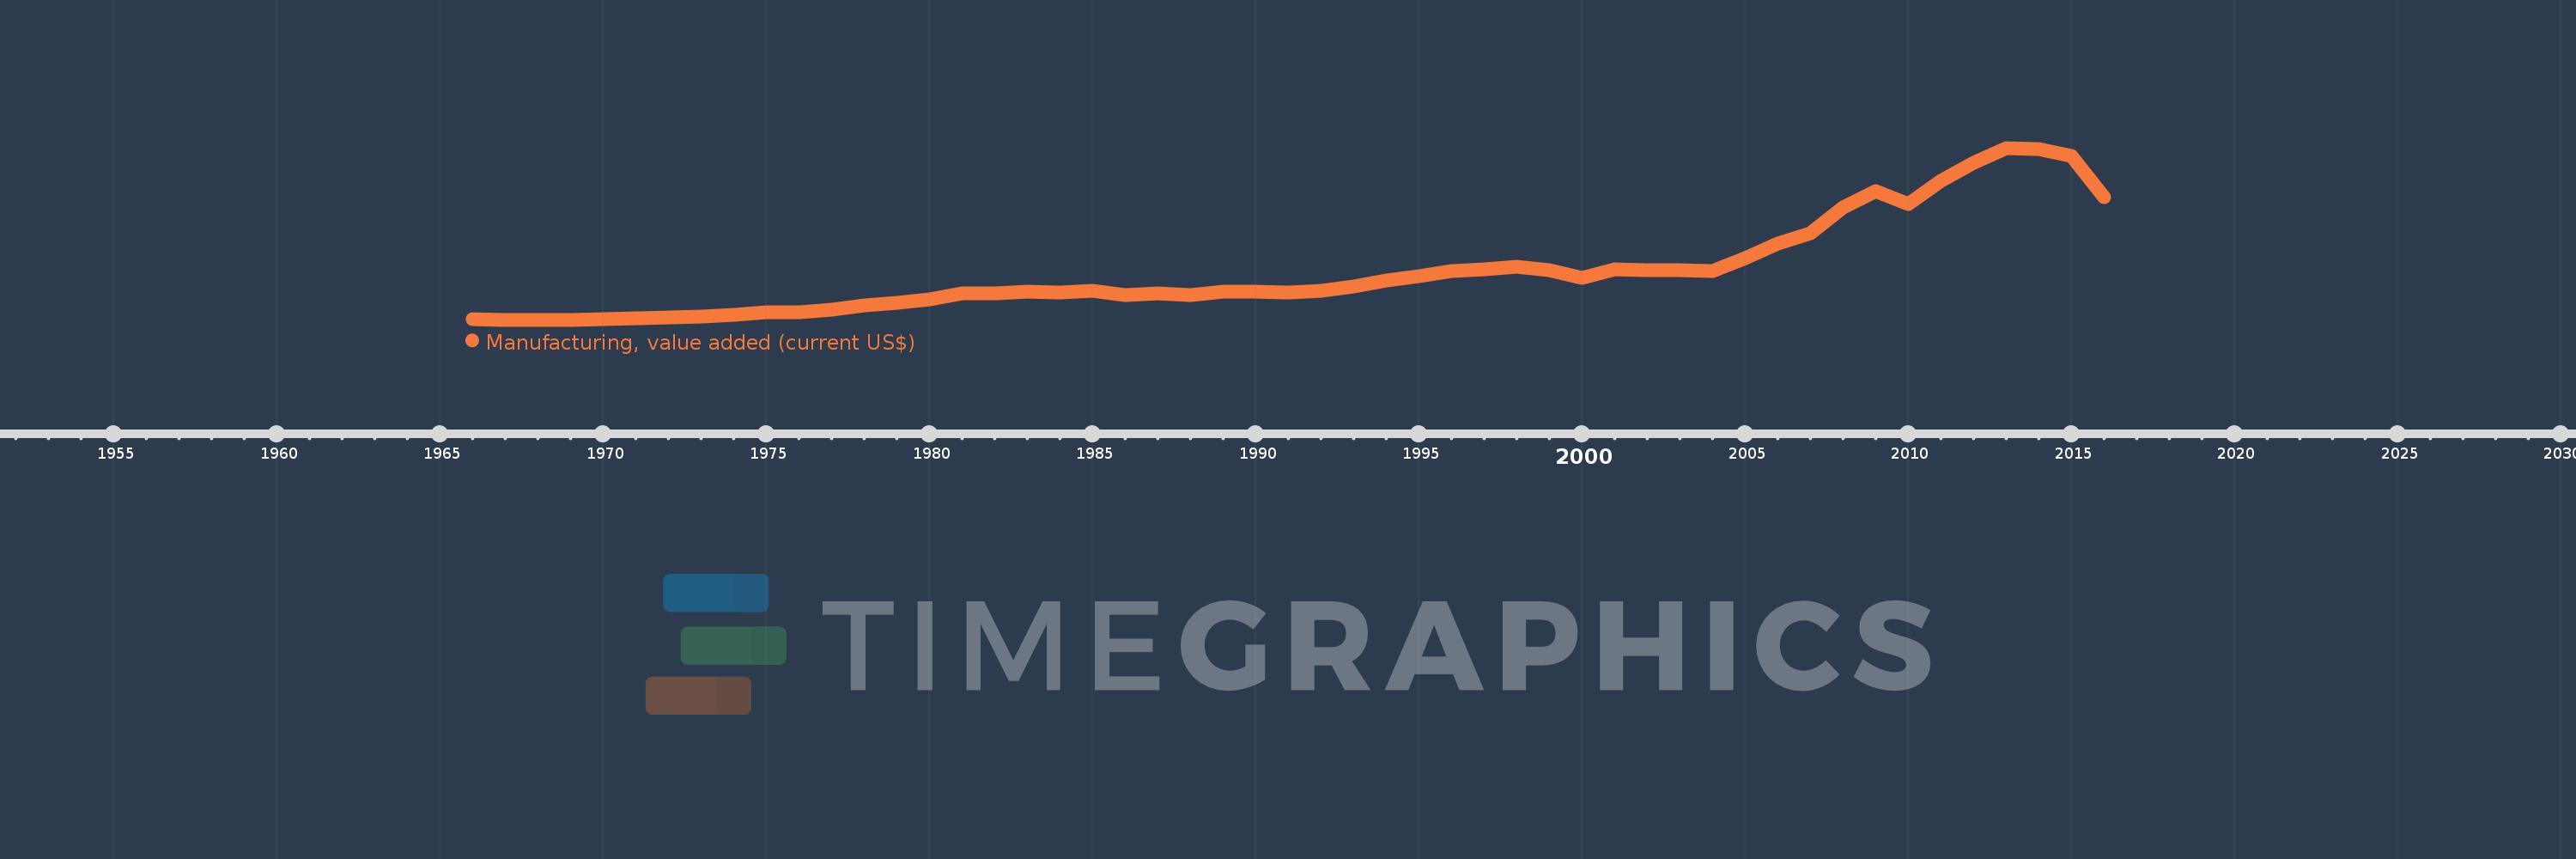
Manufacturing, value added (current US$)
2016,2015,2014,2013,2012,2011,2010,2009,2008,2007,2006,2005,2004,2003,2002,2001,2000,1999,1998,1997,1996,1995,1994,1993,1992,1991,1990,1989,1988,1987,1986,1985,1984,1983,1982,1981,1980,1979,1978,1977,1976,1975,1974,1973,1972,1971,1970,1969,1968,1967,1966
This statistics in other country:
AfghanistanAlbaniaAlgeriaAndorraAngolaAntigua and BarbudaArab WorldArgentinaArmeniaArubaAustraliaAustriaAzerbaijanBahamas, TheBahrainBangladeshBarbadosBelarusBelgiumBelizeBeninBermudaBhutanBoliviaBosnia and HerzegovinaBotswanaBrazilBrunei DarussalamBurkina FasoBurundiCabo VerdeCambodiaCameroonCanadaCaribbean small statesCayman IslandsCentral African RepublicCentral Europe and the BalticsChadChileChinaColombiaComorosCongo, Dem. Rep.Congo, Rep.Costa RicaCote d'IvoireCroatiaCubaCyprusCzech RepublicDenmarkDjiboutiDominicaDominican RepublicEarly-demographic dividendEast Asia & PacificEast Asia & Pacific (excluding high income)East Asia & Pacific (IDA & IBRD countries)EcuadorEgypt, Arab Rep.El SalvadorEquatorial GuineaEritreaEstoniaEthiopiaEuro areaEurope & Central AsiaEurope & Central Asia (excluding high income)Europe & Central Asia (IDA & IBRD countries)European UnionFaroe IslandsFijiFinlandFragile and conflict affected situationsFranceGabonGambia, TheGeorgiaGermanyGhanaGreeceGrenadaGuatemalaGuineaGuinea-BissauGuyanaHeavily indebted poor countries (HIPC)High incomeHondurasHong Kong SAR, ChinaHungaryIBRD onlyIcelandIDA & IBRD totalIDA blendIDA onlyIDA totalIndiaIndonesiaIran, Islamic Rep.IraqIrelandItalyJamaicaJapanJordanKazakhstanKenyaKiribatiKorea, Rep.KosovoKuwaitKyrgyz RepublicLao PDRLate-demographic dividendLatin America & Caribbean Latin America & Caribbean (excluding high income)Latin America & the Caribbean (IDA & IBRD countries)LatviaLeast developed countries: UN classificationLebanonLesothoLiberiaLibyaLithuaniaLow & middle incomeLow incomeLower middle incomeLuxembourgMacao SAR, ChinaMacedonia, FYRMadagascarMalawiMalaysiaMaldivesMaliMaltaMarshall IslandsMauritaniaMauritiusMexicoMicronesia, Fed. Sts.Middle East & North AfricaMiddle East & North Africa (excluding high income)Middle East & North Africa (IDA & IBRD countries)Middle incomeMoldovaMongoliaMontenegroMoroccoMozambiqueMyanmarNamibiaNepalNetherlandsNew CaledoniaNew ZealandNicaraguaNigerNigeriaNorth AmericaNorwayOECD membersOmanOther small statesPacific island small statesPakistanPalauPanamaPapua New GuineaParaguayPeruPhilippinesPolandPortugalPost-demographic dividendPre-demographic dividendPuerto RicoQatarRomaniaRussian FederationRwandaSamoaSao Tome and PrincipeSaudi ArabiaSenegalSerbiaSeychellesSierra LeoneSingaporeSlovak RepublicSloveniaSmall statesSolomon IslandsSouth AfricaSouth AsiaSouth Asia (IDA & IBRD)SpainSri LankaSt. Kitts and NevisSt. LuciaSt. Vincent and the GrenadinesSub-Saharan Africa Sub-Saharan Africa (excluding high income)Sub-Saharan Africa (IDA & IBRD countries)SudanSurinameSwazilandSwedenSwitzerlandSyrian Arab RepublicTajikistanTanzaniaThailandTimor-LesteTogoTongaTrinidad and TobagoTunisiaTurkeyTurkmenistanTuvaluUgandaUkraineUnited Arab EmiratesUnited KingdomUnited StatesUpper middle incomeUruguayUzbekistanVanuatuVenezuela, RBVietnamWest Bank and GazaWorldYemen, Rep.ZambiaZimbabwe Timeline:
This timeline shows a graph from 1966 to 2016 of Colombia. No data until 1965. Number of actual observations by date: 51.
Source name:
World Development Indicators
Source organization:
World Bank national accounts data, and OECD National Accounts data files.
Categories, topics:
Economy & Growth
Last updated:
apr 23, 2017
Indicators value changes by year
Minimum:
1.053 bln
jan 1, 1967
Maximum:
45.181 bln
jan 1, 2013
At the date of observation
Value
Absolute change
Change from previous value
jan 1, 1966
1.14 bln
+1.14 bln
0.0%
jan 1, 1967
1.053 bln
-86.857 mln
-7.62%
jan 1, 1968
1.08 bln
+26.818 mln
2.55%
jan 1, 1969
1.077 bln
-2.383 mln
-0.22%
jan 1, 1970
1.175 bln
+97.487 mln
9.05%
jan 1, 1971
1.487 bln
+312.628 mln
26.61%
jan 1, 1972
1.593 bln
+106.063 mln
7.13%
jan 1, 1973
1.853 bln
+259.678 mln
16.3%
jan 1, 1974
2.344 bln
+491.033 mln
26.5%
jan 1, 1975
2.868 bln
+523.724 mln
22.34%
jan 1, 1976
3.042 bln
+174.299 mln
6.08%
jan 1, 1977
3.709 bln
+666.687 mln
21.92%
jan 1, 1978
4.642 bln
+933.17 mln
25.16%
jan 1, 1979
5.406 bln
+764.186 mln
16.46%
jan 1, 1980
6.278 bln
+871.358 mln
16.12%
jan 1, 1981
7.772 bln
+1.495 bln
23.81%
jan 1, 1982
7.756 bln
-16.335 mln
-0.21%
jan 1, 1983
8.269 bln
+513.005 mln
6.61%
jan 1, 1984
8.126 bln
-142.972 mln
-1.73%
jan 1, 1985
8.458 bln
+332.042 mln
4.09%
jan 1, 1986
7.463 bln
-995.207 mln
-11.77%
jan 1, 1987
7.854 bln
+391.138 mln
5.24%
jan 1, 1988
7.39 bln
-463.772 mln
-5.9%
jan 1, 1989
8.297 bln
+906.391 mln
12.26%
jan 1, 1990
8.259 bln
-37.959 mln
-0.46%
jan 1, 1991
8.034 bln
-224.336 mln
-2.72%
jan 1, 1992
8.422 bln
+388.086 mln
4.83%
jan 1, 1993
9.548 bln
+1.126 bln
13.37%
jan 1, 1994
11.168 bln
+1.62 bln
16.97%
jan 1, 1995
12.159 bln
+991.115 mln
8.87%
jan 1, 1996
13.507 bln
+1.348 bln
11.08%
jan 1, 1997
13.907 bln
+399.71 mln
2.96%
jan 1, 1998
14.629 bln
+722.224 mln
5.19%
jan 1, 1999
13.77 bln
-858.856 mln
-5.87%
jan 1, 2000
11.861 bln
-1.909 bln
-13.86%
jan 1, 2001
13.917 bln
+2.056 bln
17.33%
jan 1, 2002
13.883 bln
-33.669 mln
-0.24%
jan 1, 2003
13.743 bln
-140.306 mln
-1.01%
jan 1, 2004
13.481 bln
-262.246 mln
-1.91%
jan 1, 2005
16.874 bln
+3.394 bln
25.18%
jan 1, 2006
20.718 bln
+3.843 bln
22.77%
jan 1, 2007
23.169 bln
+2.452 bln
11.83%
jan 1, 2008
29.984 bln
+6.815 bln
29.41%
jan 1, 2009
33.984 bln
+3.999 bln
13.34%
jan 1, 2010
30.779 bln
-3.205 bln
-9.43%
jan 1, 2011
36.621 bln
+5.842 bln
18.98%
jan 1, 2012
41.391 bln
+4.771 bln
13.03%
jan 1, 2013
45.181 bln
+3.79 bln
9.16%
jan 1, 2014
44.957 bln
-224.238 mln
-0.5%
jan 1, 2015
43.143 bln
-1.814 bln
-4.03%
jan 1, 2016
32.611 bln
-10.532 bln
-24.41%
Ranking of countries by current statistics by years


Comments: