29
/
en
AIzaSyAYiBZKx7MnpbEhh9jyipgxe19OcubqV5w
April 1, 2024
135776
Gabon
GAB
true
2
1
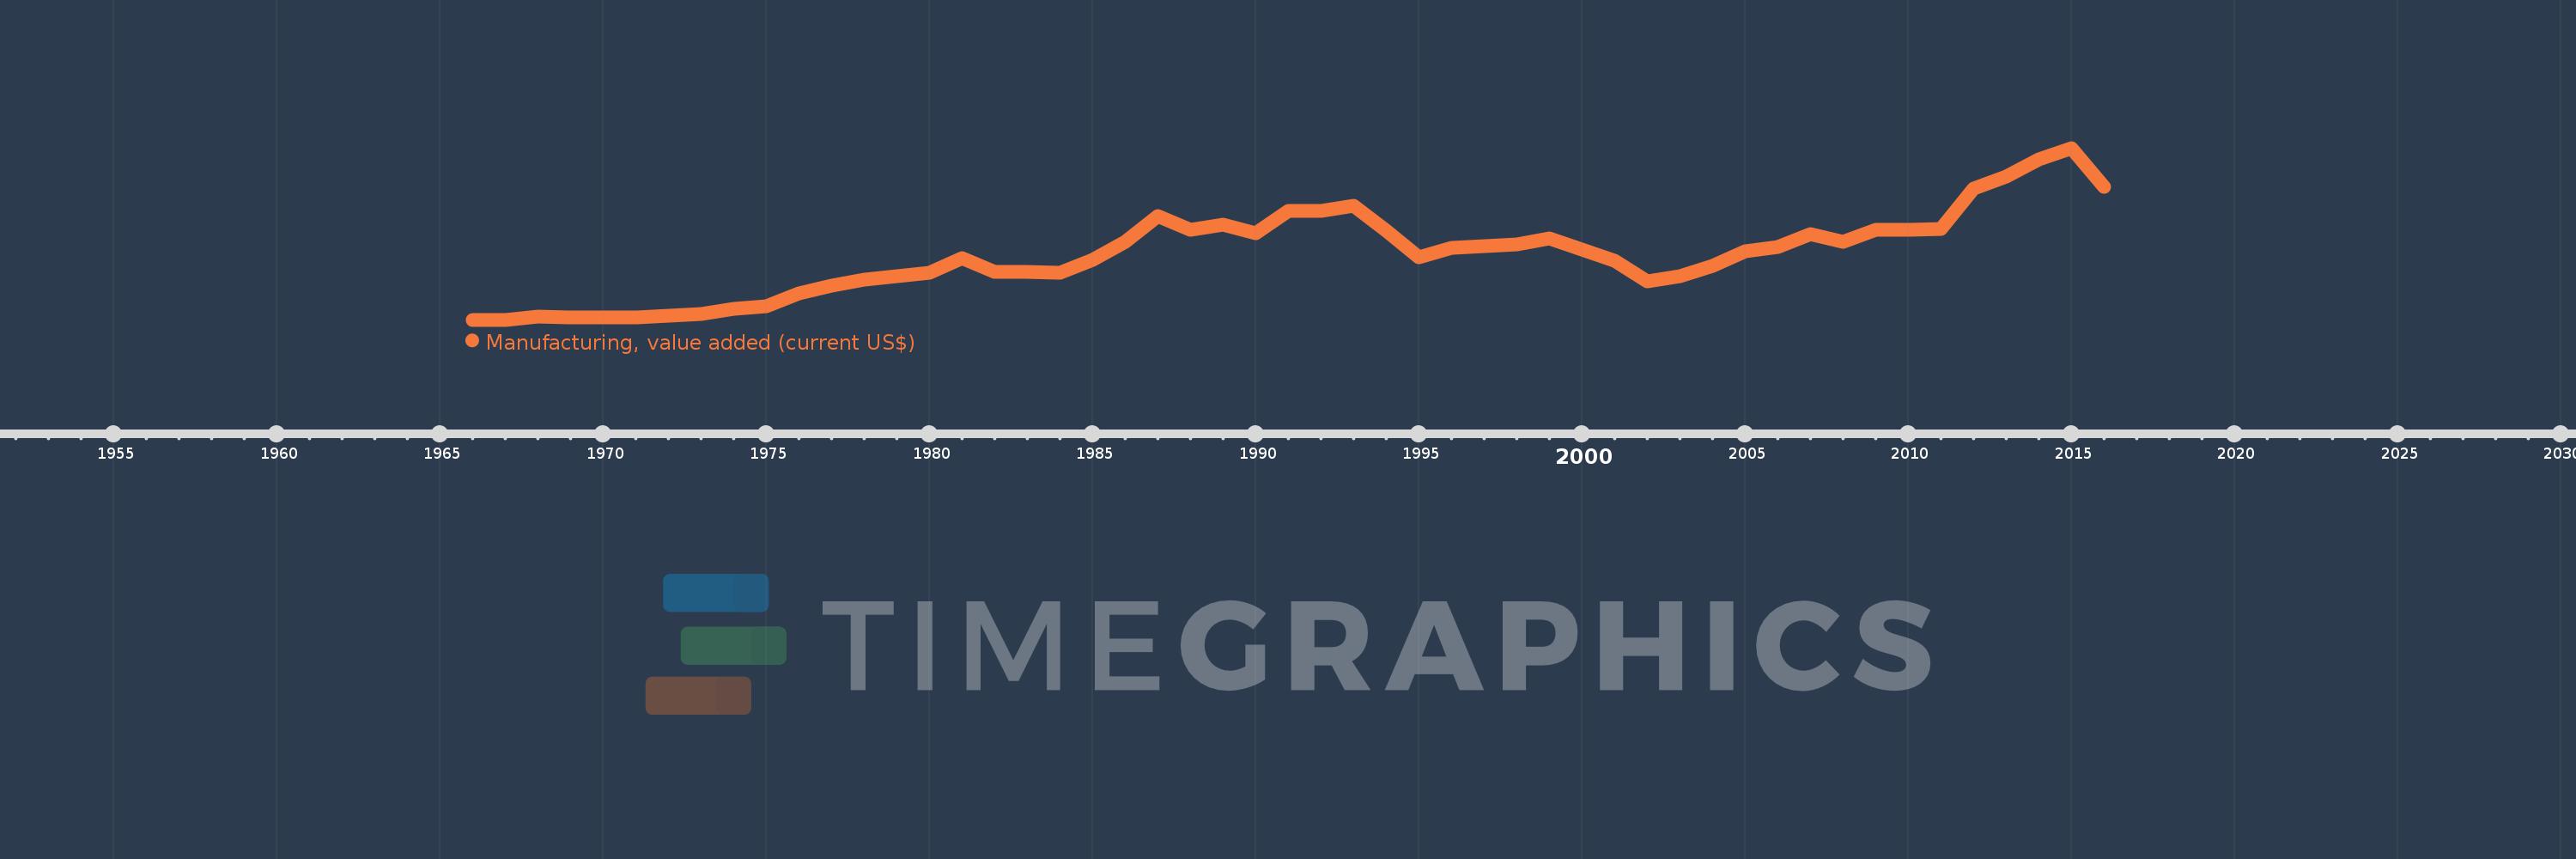
Manufacturing, value added (current US$)
2016,2015,2014,2013,2012,2011,2010,2009,2008,2007,2006,2005,2004,2003,2002,2001,2000,1999,1998,1997,1996,1995,1994,1993,1992,1991,1990,1989,1988,1987,1986,1985,1984,1983,1982,1981,1980,1979,1978,1977,1976,1975,1974,1973,1972,1971,1970,1969,1968,1967,1966
This statistics in other country:
AfghanistanAlbaniaAlgeriaAndorraAngolaAntigua and BarbudaArab WorldArgentinaArmeniaArubaAustraliaAustriaAzerbaijanBahamas, TheBahrainBangladeshBarbadosBelarusBelgiumBelizeBeninBermudaBhutanBoliviaBosnia and HerzegovinaBotswanaBrazilBrunei DarussalamBurkina FasoBurundiCabo VerdeCambodiaCameroonCanadaCaribbean small statesCayman IslandsCentral African RepublicCentral Europe and the BalticsChadChileChinaColombiaComorosCongo, Dem. Rep.Congo, Rep.Costa RicaCote d'IvoireCroatiaCubaCyprusCzech RepublicDenmarkDjiboutiDominicaDominican RepublicEarly-demographic dividendEast Asia & PacificEast Asia & Pacific (excluding high income)East Asia & Pacific (IDA & IBRD countries)EcuadorEgypt, Arab Rep.El SalvadorEquatorial GuineaEritreaEstoniaEthiopiaEuro areaEurope & Central AsiaEurope & Central Asia (excluding high income)Europe & Central Asia (IDA & IBRD countries)European UnionFaroe IslandsFijiFinlandFragile and conflict affected situationsFranceGabonGambia, TheGeorgiaGermanyGhanaGreeceGrenadaGuatemalaGuineaGuinea-BissauGuyanaHeavily indebted poor countries (HIPC)High incomeHondurasHong Kong SAR, ChinaHungaryIBRD onlyIcelandIDA & IBRD totalIDA blendIDA onlyIDA totalIndiaIndonesiaIran, Islamic Rep.IraqIrelandItalyJamaicaJapanJordanKazakhstanKenyaKiribatiKorea, Rep.KosovoKuwaitKyrgyz RepublicLao PDRLate-demographic dividendLatin America & Caribbean Latin America & Caribbean (excluding high income)Latin America & the Caribbean (IDA & IBRD countries)LatviaLeast developed countries: UN classificationLebanonLesothoLiberiaLibyaLithuaniaLow & middle incomeLow incomeLower middle incomeLuxembourgMacao SAR, ChinaMacedonia, FYRMadagascarMalawiMalaysiaMaldivesMaliMaltaMarshall IslandsMauritaniaMauritiusMexicoMicronesia, Fed. Sts.Middle East & North AfricaMiddle East & North Africa (excluding high income)Middle East & North Africa (IDA & IBRD countries)Middle incomeMoldovaMongoliaMontenegroMoroccoMozambiqueMyanmarNamibiaNepalNetherlandsNew CaledoniaNew ZealandNicaraguaNigerNigeriaNorth AmericaNorwayOECD membersOmanOther small statesPacific island small statesPakistanPalauPanamaPapua New GuineaParaguayPeruPhilippinesPolandPortugalPost-demographic dividendPre-demographic dividendPuerto RicoQatarRomaniaRussian FederationRwandaSamoaSao Tome and PrincipeSaudi ArabiaSenegalSerbiaSeychellesSierra LeoneSingaporeSlovak RepublicSloveniaSmall statesSolomon IslandsSouth AfricaSouth AsiaSouth Asia (IDA & IBRD)SpainSri LankaSt. Kitts and NevisSt. LuciaSt. Vincent and the GrenadinesSub-Saharan Africa Sub-Saharan Africa (excluding high income)Sub-Saharan Africa (IDA & IBRD countries)SudanSurinameSwazilandSwedenSwitzerlandSyrian Arab RepublicTajikistanTanzaniaThailandTimor-LesteTogoTongaTrinidad and TobagoTunisiaTurkeyTurkmenistanTuvaluUgandaUkraineUnited Arab EmiratesUnited KingdomUnited StatesUpper middle incomeUruguayUzbekistanVanuatuVenezuela, RBVietnamWest Bank and GazaWorldYemen, Rep.ZambiaZimbabwe Timeline:
This timeline shows a graph from 1966 to 2016 of Gabon. No data until 1965. Number of actual observations by date: 51.
Source name:
World Development Indicators
Source organization:
World Bank national accounts data, and OECD National Accounts data files.
Categories, topics:
Economy & Growth
Last updated:
apr 23, 2017
Indicators value changes by year
Minimum:
16.281 mln
jan 1, 1967
Maximum:
515.394 mln
jan 1, 2015
At the date of observation
Value
Absolute change
Change from previous value
jan 1, 1966
16.322 mln
+16.322 mln
0.0%
jan 1, 1967
16.281 mln
-41.026K
-0.25%
jan 1, 1968
24.797 mln
+8.515 mln
52.3%
jan 1, 1969
23.428 mln
-1.368 mln
-5.52%
jan 1, 1970
22.696 mln
-732.475K
-3.13%
jan 1, 1971
22.069 mln
-626.535K
-2.76%
jan 1, 1972
27.237 mln
+5.168 mln
23.42%
jan 1, 1973
33.33 mln
+6.092 mln
22.37%
jan 1, 1974
48.006 mln
+14.676 mln
44.03%
jan 1, 1975
56.501 mln
+8.495 mln
17.7%
jan 1, 1976
91.922 mln
+35.421 mln
62.69%
jan 1, 1977
116.342 mln
+24.42 mln
26.57%
jan 1, 1978
132.693 mln
+16.351 mln
14.05%
jan 1, 1979
142.695 mln
+10.002 mln
7.54%
jan 1, 1980
151.842 mln
+9.146 mln
6.41%
jan 1, 1981
195.002 mln
+43.161 mln
28.42%
jan 1, 1982
155.668 mln
-39.334 mln
-20.17%
jan 1, 1983
155.201 mln
-467.426K
-0.3%
jan 1, 1984
151.942 mln
-3.259 mln
-2.1%
jan 1, 1985
191.323 mln
+39.381 mln
25.92%
jan 1, 1986
242.13 mln
+50.807 mln
26.56%
jan 1, 1987
317.321 mln
+75.191 mln
31.05%
jan 1, 1988
278.236 mln
-39.085 mln
-12.32%
jan 1, 1989
291.524 mln
+13.289 mln
4.78%
jan 1, 1990
268.018 mln
-23.506 mln
-8.06%
jan 1, 1991
332.397 mln
+64.379 mln
24.02%
jan 1, 1992
333.491 mln
+1.094 mln
0.33%
jan 1, 1993
346.441 mln
+12.95 mln
3.88%
jan 1, 1994
275.503 mln
-70.938 mln
-20.48%
jan 1, 1995
198.269 mln
-77.234 mln
-28.03%
jan 1, 1996
224.382 mln
+26.113 mln
13.17%
jan 1, 1997
231.257 mln
+6.875 mln
3.06%
jan 1, 1998
234.208 mln
+2.951 mln
1.28%
jan 1, 1999
251.546 mln
+17.338 mln
7.4%
jan 1, 2000
220.4 mln
-31.146 mln
-12.38%
jan 1, 2001
188.77 mln
-31.63 mln
-14.35%
jan 1, 2002
127.538 mln
-61.233 mln
-32.44%
jan 1, 2003
142.028 mln
+14.491 mln
11.36%
jan 1, 2004
173.305 mln
+31.277 mln
22.02%
jan 1, 2005
215.759 mln
+42.453 mln
24.5%
jan 1, 2006
227.563 mln
+11.804 mln
5.47%
jan 1, 2007
264.7 mln
+37.137 mln
16.32%
jan 1, 2008
243.731 mln
-20.969 mln
-7.92%
jan 1, 2009
276.634 mln
+32.903 mln
13.5%
jan 1, 2010
276.662 mln
+28.37K
0.01%
jan 1, 2011
279.134 mln
+2.472 mln
0.89%
jan 1, 2012
397.747 mln
+118.613 mln
42.49%
jan 1, 2013
432.697 mln
+34.949 mln
8.79%
jan 1, 2014
481.143 mln
+48.447 mln
11.2%
jan 1, 2015
515.394 mln
+34.251 mln
7.12%
jan 1, 2016
403.472 mln
-111.922 mln
-21.72%
Ranking of countries by current statistics by years


Comments: