29
/
en
AIzaSyAYiBZKx7MnpbEhh9jyipgxe19OcubqV5w
April 1, 2024
191633
Malta
MLT
true
2
1
Manufacturing, value added (current US$)
2016,2015,2014,2013,2012,2011,2010,2009,2008,2007,2006,2005,2004,2003,2002,2001,2000,1999,1998,1997,1996,1995,1994,1993,1992,1991,1990,1989,1988,1987,1986,1985,1984,1983,1982,1981,1980,1979,1978,1977,1976,1975,1974,1973,1972,1971
This statistics in other country:
AfghanistanAlbaniaAlgeriaAndorraAngolaAntigua and BarbudaArab WorldArgentinaArmeniaArubaAustraliaAustriaAzerbaijanBahamas, TheBahrainBangladeshBarbadosBelarusBelgiumBelizeBeninBermudaBhutanBoliviaBosnia and HerzegovinaBotswanaBrazilBrunei DarussalamBurkina FasoBurundiCabo VerdeCambodiaCameroonCanadaCaribbean small statesCayman IslandsCentral African RepublicCentral Europe and the BalticsChadChileChinaColombiaComorosCongo, Dem. Rep.Congo, Rep.Costa RicaCote d'IvoireCroatiaCubaCyprusCzech RepublicDenmarkDjiboutiDominicaDominican RepublicEarly-demographic dividendEast Asia & PacificEast Asia & Pacific (excluding high income)East Asia & Pacific (IDA & IBRD countries)EcuadorEgypt, Arab Rep.El SalvadorEquatorial GuineaEritreaEstoniaEthiopiaEuro areaEurope & Central AsiaEurope & Central Asia (excluding high income)Europe & Central Asia (IDA & IBRD countries)European UnionFaroe IslandsFijiFinlandFragile and conflict affected situationsFranceGabonGambia, TheGeorgiaGermanyGhanaGreeceGrenadaGuatemalaGuineaGuinea-BissauGuyanaHeavily indebted poor countries (HIPC)High incomeHondurasHong Kong SAR, ChinaHungaryIBRD onlyIcelandIDA & IBRD totalIDA blendIDA onlyIDA totalIndiaIndonesiaIran, Islamic Rep.IraqIrelandItalyJamaicaJapanJordanKazakhstanKenyaKiribatiKorea, Rep.KosovoKuwaitKyrgyz RepublicLao PDRLate-demographic dividendLatin America & Caribbean Latin America & Caribbean (excluding high income)Latin America & the Caribbean (IDA & IBRD countries)LatviaLeast developed countries: UN classificationLebanonLesothoLiberiaLibyaLithuaniaLow & middle incomeLow incomeLower middle incomeLuxembourgMacao SAR, ChinaMacedonia, FYRMadagascarMalawiMalaysiaMaldivesMaliMaltaMarshall IslandsMauritaniaMauritiusMexicoMicronesia, Fed. Sts.Middle East & North AfricaMiddle East & North Africa (excluding high income)Middle East & North Africa (IDA & IBRD countries)Middle incomeMoldovaMongoliaMontenegroMoroccoMozambiqueMyanmarNamibiaNepalNetherlandsNew CaledoniaNew ZealandNicaraguaNigerNigeriaNorth AmericaNorwayOECD membersOmanOther small statesPacific island small statesPakistanPalauPanamaPapua New GuineaParaguayPeruPhilippinesPolandPortugalPost-demographic dividendPre-demographic dividendPuerto RicoQatarRomaniaRussian FederationRwandaSamoaSao Tome and PrincipeSaudi ArabiaSenegalSerbiaSeychellesSierra LeoneSingaporeSlovak RepublicSloveniaSmall statesSolomon IslandsSouth AfricaSouth AsiaSouth Asia (IDA & IBRD)SpainSri LankaSt. Kitts and NevisSt. LuciaSt. Vincent and the GrenadinesSub-Saharan Africa Sub-Saharan Africa (excluding high income)Sub-Saharan Africa (IDA & IBRD countries)SudanSurinameSwazilandSwedenSwitzerlandSyrian Arab RepublicTajikistanTanzaniaThailandTimor-LesteTogoTongaTrinidad and TobagoTunisiaTurkeyTurkmenistanTuvaluUgandaUkraineUnited Arab EmiratesUnited KingdomUnited StatesUpper middle incomeUruguayUzbekistanVanuatuVenezuela, RBVietnamWest Bank and GazaWorldYemen, Rep.ZambiaZimbabwe Timeline:
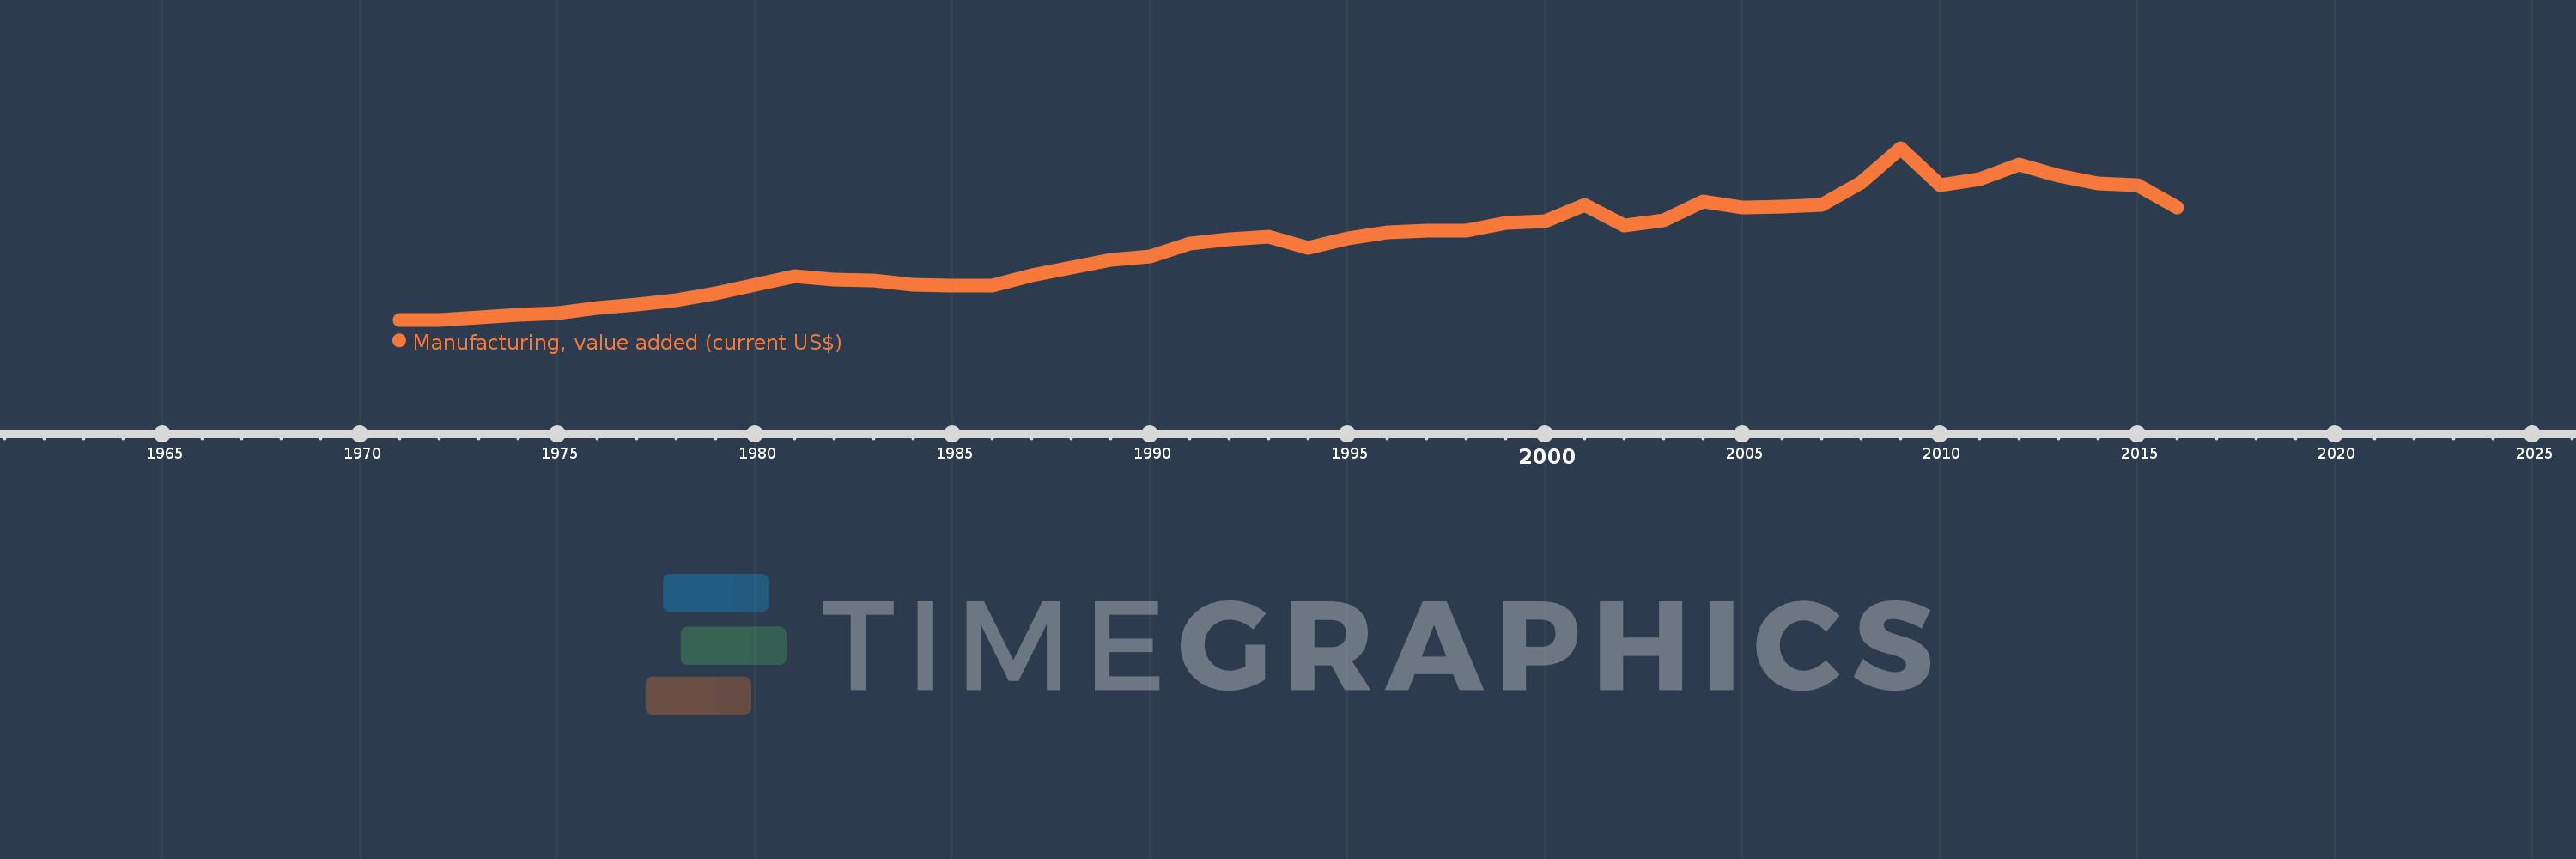
This timeline shows a graph from 1971 to 2016 of Malta. No data until 1970. Number of actual observations by date: 46.
Source name:
World Development Indicators
Source organization:
World Bank national accounts data, and OECD National Accounts data files.
Categories, topics:
Economy & Growth
Last updated:
apr 23, 2017
Indicators value changes by year
Minimum:
42.617 mln
jan 1, 1972
Maximum:
1.206 bln
jan 1, 2009
At the date of observation
Value
Absolute change
Change from previous value
jan 1, 1971
43.246 mln
+43.246 mln
0.0%
jan 1, 1972
42.617 mln
-628.201K
-1.45%
jan 1, 1973
58.254 mln
+15.637 mln
36.69%
jan 1, 1974
73.054 mln
+14.799 mln
25.4%
jan 1, 1975
88.091 mln
+15.037 mln
20.58%
jan 1, 1976
122.375 mln
+34.285 mln
38.92%
jan 1, 1977
145.828 mln
+23.453 mln
19.16%
jan 1, 1978
173.394 mln
+27.567 mln
18.9%
jan 1, 1979
221.015 mln
+47.621 mln
27.46%
jan 1, 1980
281.312 mln
+60.297 mln
27.28%
jan 1, 1981
336.858 mln
+55.546 mln
19.75%
jan 1, 1982
316.601 mln
-20.257 mln
-6.01%
jan 1, 1983
305.986 mln
-10.615 mln
-3.35%
jan 1, 1984
279.983 mln
-26.003 mln
-8.5%
jan 1, 1985
272.837 mln
-7.147 mln
-2.55%
jan 1, 1986
272.897 mln
+60.749K
0.02%
jan 1, 1987
345.667 mln
+72.77 mln
26.67%
jan 1, 1988
398.283 mln
+52.615 mln
15.22%
jan 1, 1989
446.787 mln
+48.504 mln
12.18%
jan 1, 1990
473.675 mln
+26.888 mln
6.02%
jan 1, 1991
557.417 mln
+83.742 mln
17.68%
jan 1, 1992
587.003 mln
+29.586 mln
5.31%
jan 1, 1993
606.46 mln
+19.458 mln
3.31%
jan 1, 1994
530.182 mln
-76.279 mln
-12.58%
jan 1, 1995
595.187 mln
+65.005 mln
12.26%
jan 1, 1996
634.849 mln
+39.662 mln
6.66%
jan 1, 1997
648.404 mln
+13.555 mln
2.14%
jan 1, 1998
643.755 mln
-4.649 mln
-0.72%
jan 1, 1999
699.414 mln
+55.659 mln
8.65%
jan 1, 2000
712.118 mln
+12.704 mln
1.82%
jan 1, 2001
822.751 mln
+110.633 mln
15.54%
jan 1, 2002
678.813 mln
-143.938 mln
-17.49%
jan 1, 2003
718.147 mln
+39.333 mln
5.79%
jan 1, 2004
843.746 mln
+125.6 mln
17.49%
jan 1, 2005
802.815 mln
-40.931 mln
-4.85%
jan 1, 2006
809.228 mln
+6.413 mln
0.8%
jan 1, 2007
820.349 mln
+11.121 mln
1.37%
jan 1, 2008
969.067 mln
+148.718 mln
18.13%
jan 1, 2009
1.206 bln
+236.441 mln
24.4%
jan 1, 2010
956.238 mln
-249.27 mln
-20.68%
jan 1, 2011
992.98 mln
+36.742 mln
3.84%
jan 1, 2012
1.093 bln
+100.431 mln
10.11%
jan 1, 2013
1.017 bln
-76.58 mln
-7.0%
jan 1, 2014
965.082 mln
-51.749 mln
-5.09%
jan 1, 2015
954.491 mln
-10.591 mln
-1.1%
jan 1, 2016
804.924 mln
-149.567 mln
-15.67%
Ranking of countries by current statistics by years


Comments: