29
/
en
AIzaSyAYiBZKx7MnpbEhh9jyipgxe19OcubqV5w
April 1, 2024
24274
Arab World
ARB
false
2
1
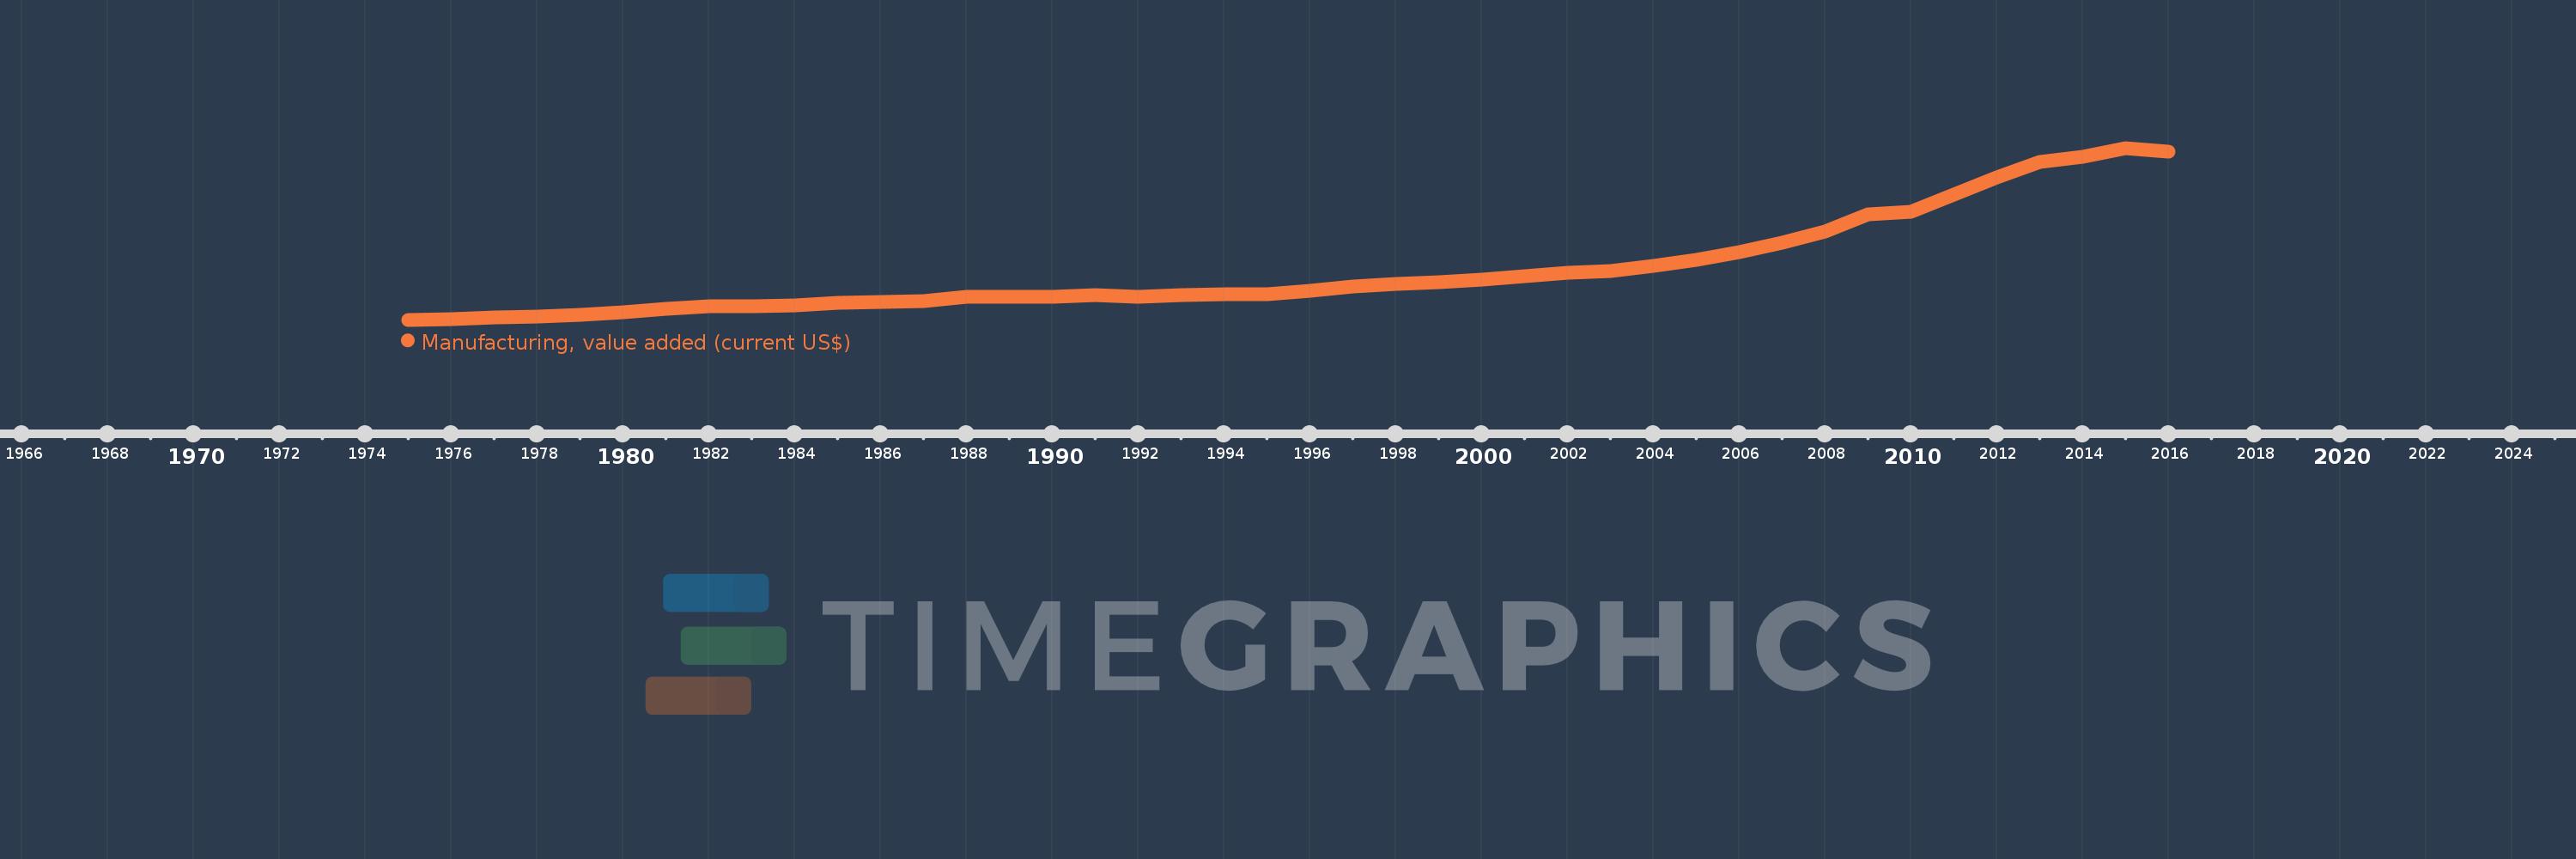
Manufacturing, value added (current US$)
2016,2015,2014,2013,2012,2011,2010,2009,2008,2007,2006,2005,2004,2003,2002,2001,2000,1999,1998,1997,1996,1995,1994,1993,1992,1991,1990,1989,1988,1987,1986,1985,1984,1983,1982,1981,1980,1979,1978,1977,1976,1975
This statistics in other country:
AfghanistanAlbaniaAlgeriaAndorraAngolaAntigua and BarbudaArab WorldArgentinaArmeniaArubaAustraliaAustriaAzerbaijanBahamas, TheBahrainBangladeshBarbadosBelarusBelgiumBelizeBeninBermudaBhutanBoliviaBosnia and HerzegovinaBotswanaBrazilBrunei DarussalamBurkina FasoBurundiCabo VerdeCambodiaCameroonCanadaCaribbean small statesCayman IslandsCentral African RepublicCentral Europe and the BalticsChadChileChinaColombiaComorosCongo, Dem. Rep.Congo, Rep.Costa RicaCote d'IvoireCroatiaCubaCyprusCzech RepublicDenmarkDjiboutiDominicaDominican RepublicEarly-demographic dividendEast Asia & PacificEast Asia & Pacific (excluding high income)East Asia & Pacific (IDA & IBRD countries)EcuadorEgypt, Arab Rep.El SalvadorEquatorial GuineaEritreaEstoniaEthiopiaEuro areaEurope & Central AsiaEurope & Central Asia (excluding high income)Europe & Central Asia (IDA & IBRD countries)European UnionFaroe IslandsFijiFinlandFragile and conflict affected situationsFranceGabonGambia, TheGeorgiaGermanyGhanaGreeceGrenadaGuatemalaGuineaGuinea-BissauGuyanaHeavily indebted poor countries (HIPC)High incomeHondurasHong Kong SAR, ChinaHungaryIBRD onlyIcelandIDA & IBRD totalIDA blendIDA onlyIDA totalIndiaIndonesiaIran, Islamic Rep.IraqIrelandItalyJamaicaJapanJordanKazakhstanKenyaKiribatiKorea, Rep.KosovoKuwaitKyrgyz RepublicLao PDRLate-demographic dividendLatin America & Caribbean Latin America & Caribbean (excluding high income)Latin America & the Caribbean (IDA & IBRD countries)LatviaLeast developed countries: UN classificationLebanonLesothoLiberiaLibyaLithuaniaLow & middle incomeLow incomeLower middle incomeLuxembourgMacao SAR, ChinaMacedonia, FYRMadagascarMalawiMalaysiaMaldivesMaliMaltaMarshall IslandsMauritaniaMauritiusMexicoMicronesia, Fed. Sts.Middle East & North AfricaMiddle East & North Africa (excluding high income)Middle East & North Africa (IDA & IBRD countries)Middle incomeMoldovaMongoliaMontenegroMoroccoMozambiqueMyanmarNamibiaNepalNetherlandsNew CaledoniaNew ZealandNicaraguaNigerNigeriaNorth AmericaNorwayOECD membersOmanOther small statesPacific island small statesPakistanPalauPanamaPapua New GuineaParaguayPeruPhilippinesPolandPortugalPost-demographic dividendPre-demographic dividendPuerto RicoQatarRomaniaRussian FederationRwandaSamoaSao Tome and PrincipeSaudi ArabiaSenegalSerbiaSeychellesSierra LeoneSingaporeSlovak RepublicSloveniaSmall statesSolomon IslandsSouth AfricaSouth AsiaSouth Asia (IDA & IBRD)SpainSri LankaSt. Kitts and NevisSt. LuciaSt. Vincent and the GrenadinesSub-Saharan Africa Sub-Saharan Africa (excluding high income)Sub-Saharan Africa (IDA & IBRD countries)SudanSurinameSwazilandSwedenSwitzerlandSyrian Arab RepublicTajikistanTanzaniaThailandTimor-LesteTogoTongaTrinidad and TobagoTunisiaTurkeyTurkmenistanTuvaluUgandaUkraineUnited Arab EmiratesUnited KingdomUnited StatesUpper middle incomeUruguayUzbekistanVanuatuVenezuela, RBVietnamWest Bank and GazaWorldYemen, Rep.ZambiaZimbabwe Timeline:
This timeline shows a graph from 1975 to 2016 of Arab World. No data until 1974. Number of actual observations by date: 42.
Source name:
World Development Indicators
Source organization:
World Bank national accounts data, and OECD National Accounts data files.
Categories, topics:
Economy & Growth
Last updated:
apr 23, 2017
Indicators value changes by year
Minimum:
7.982 bln
jan 1, 1975
Maximum:
277.149 bln
jan 1, 2015
At the date of observation
Value
Absolute change
Change from previous value
jan 1, 1975
7.982 bln
+7.982 bln
0.0%
jan 1, 1976
9.58 bln
+1.598 bln
20.01%
jan 1, 1977
11.357 bln
+1.777 bln
18.55%
jan 1, 1978
13.164 bln
+1.807 bln
15.91%
jan 1, 1979
15.361 bln
+2.197 bln
16.69%
jan 1, 1980
20.03 bln
+4.669 bln
30.4%
jan 1, 1981
24.611 bln
+4.581 bln
22.87%
jan 1, 1982
28.735 bln
+4.124 bln
16.76%
jan 1, 1983
29.158 bln
+422.838 mln
1.47%
jan 1, 1984
31.025 bln
+1.867 bln
6.4%
jan 1, 1985
35.132 bln
+4.108 bln
13.24%
jan 1, 1986
35.858 bln
+725.322 mln
2.06%
jan 1, 1987
37.778 bln
+1.92 bln
5.36%
jan 1, 1988
43.408 bln
+5.63 bln
14.9%
jan 1, 1989
44.54 bln
+1.132 bln
2.61%
jan 1, 1990
44.194 bln
-346.109 mln
-0.78%
jan 1, 1991
45.994 bln
+1.8 bln
4.07%
jan 1, 1992
43.787 bln
-2.207 bln
-4.8%
jan 1, 1993
46.833 bln
+3.046 bln
6.96%
jan 1, 1994
48.088 bln
+1.255 bln
2.68%
jan 1, 1995
48.549 bln
+460.925 mln
0.96%
jan 1, 1996
53.648 bln
+5.099 bln
10.5%
jan 1, 1997
59.496 bln
+5.848 bln
10.9%
jan 1, 1998
64.148 bln
+4.652 bln
7.82%
jan 1, 1999
66.367 bln
+2.219 bln
3.46%
jan 1, 2000
70.525 bln
+4.158 bln
6.27%
jan 1, 2001
76.2 bln
+5.676 bln
8.05%
jan 1, 2002
82.141 bln
+5.941 bln
7.8%
jan 1, 2003
84.567 bln
+2.426 bln
2.95%
jan 1, 2004
92.592 bln
+8.025 bln
9.49%
jan 1, 2005
101.378 bln
+8.786 bln
9.49%
jan 1, 2006
113.337 bln
+11.958 bln
11.8%
jan 1, 2007
128.506 bln
+15.17 bln
13.38%
jan 1, 2008
145.62 bln
+17.113 bln
13.32%
jan 1, 2009
173.696 bln
+28.076 bln
19.28%
jan 1, 2010
176.858 bln
+3.162 bln
1.82%
jan 1, 2011
204.137 bln
+27.279 bln
15.42%
jan 1, 2012
230.708 bln
+26.57 bln
13.02%
jan 1, 2013
255.146 bln
+24.438 bln
10.59%
jan 1, 2014
262.835 bln
+7.69 bln
3.01%
jan 1, 2015
277.149 bln
+14.314 bln
5.45%
jan 1, 2016
271.006 bln
-6.143 bln
-2.22%
Ranking of countries by current statistics by years


Comments: