29
/
en
AIzaSyAYiBZKx7MnpbEhh9jyipgxe19OcubqV5w
April 1, 2024
222460
Peru
PER
true
2
1
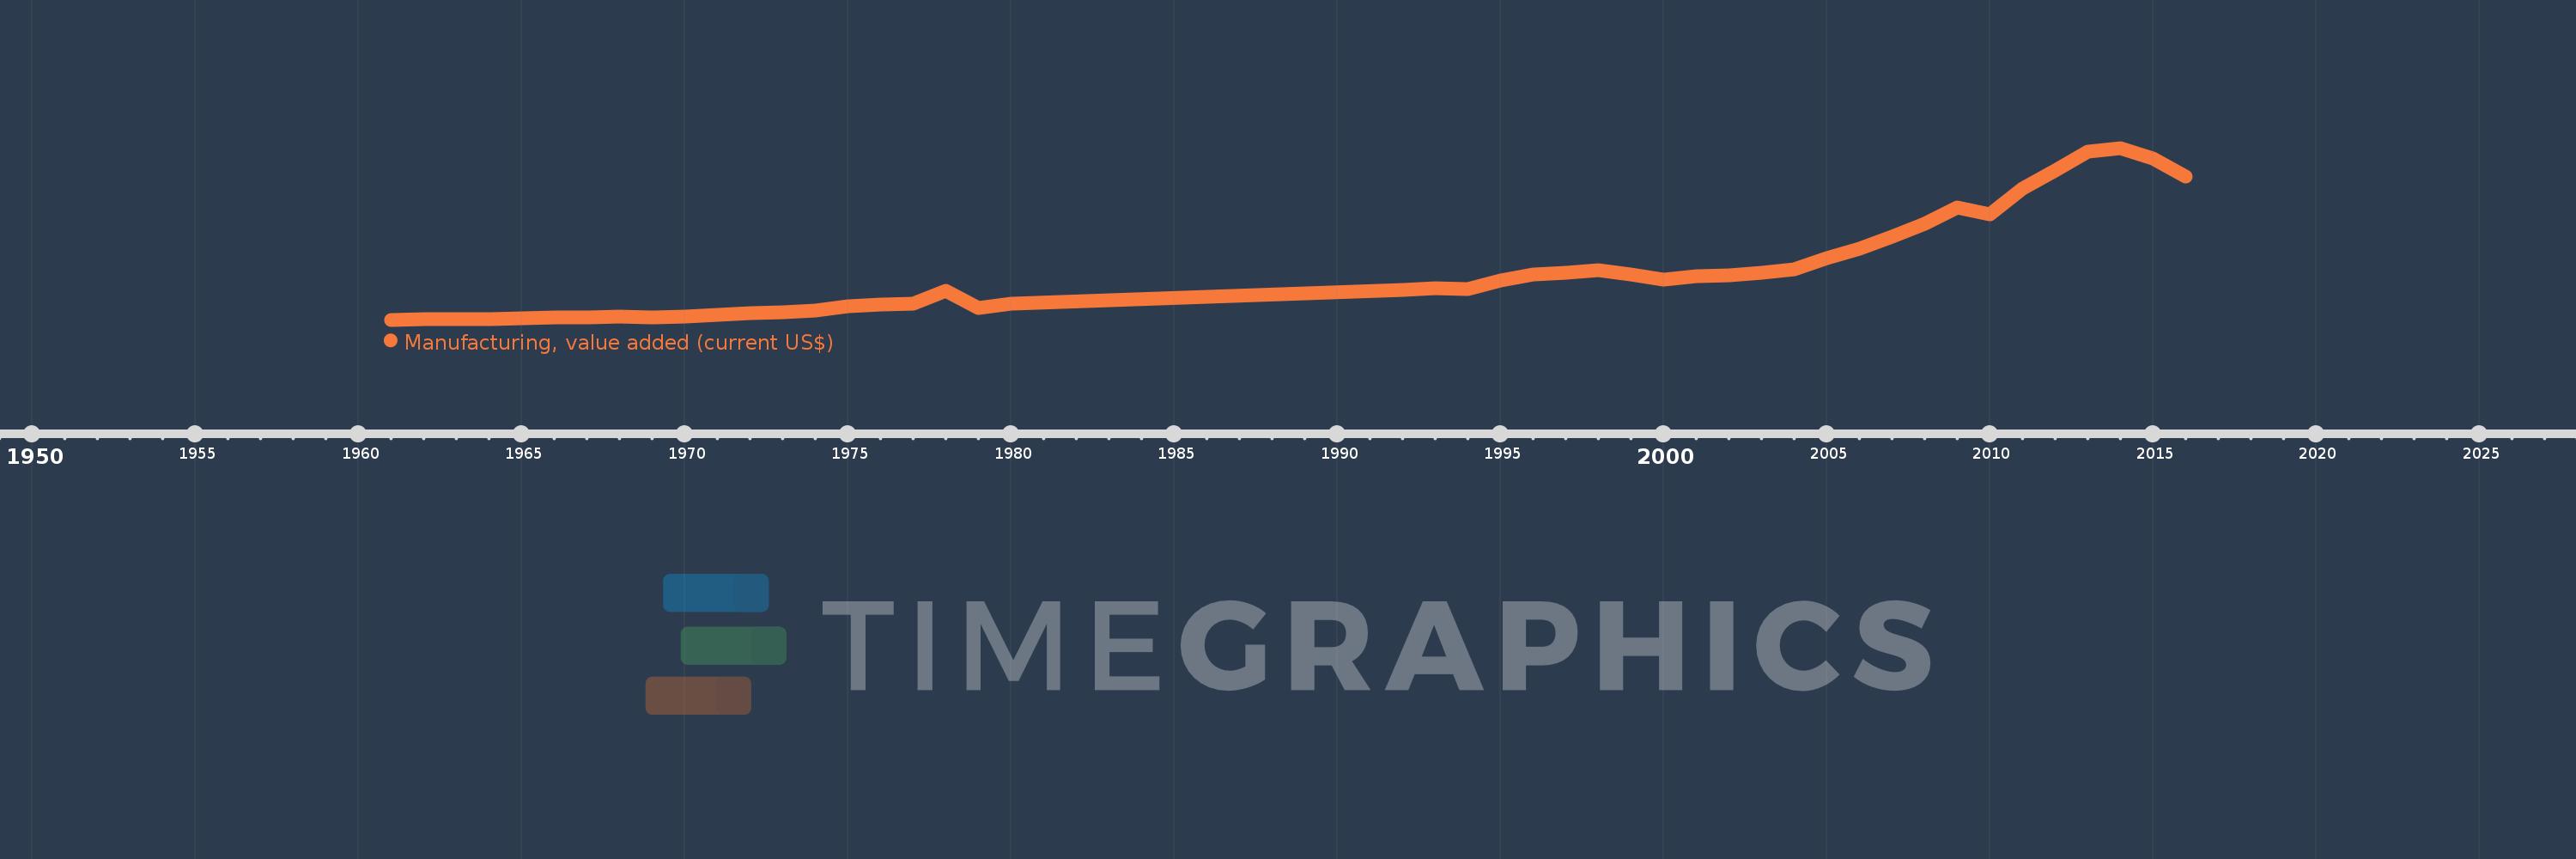
Manufacturing, value added (current US$)
2016,2015,2014,2013,2012,2011,2010,2009,2008,2007,2006,2005,2004,2003,2002,2001,2000,1999,1998,1997,1996,1995,1994,1993,1992,1980,1979,1978,1977,1976,1975,1974,1973,1972,1971,1970,1969,1968,1967,1966,1965,1964,1963,1962,1961
This statistics in other country:
AfghanistanAlbaniaAlgeriaAndorraAngolaAntigua and BarbudaArab WorldArgentinaArmeniaArubaAustraliaAustriaAzerbaijanBahamas, TheBahrainBangladeshBarbadosBelarusBelgiumBelizeBeninBermudaBhutanBoliviaBosnia and HerzegovinaBotswanaBrazilBrunei DarussalamBurkina FasoBurundiCabo VerdeCambodiaCameroonCanadaCaribbean small statesCayman IslandsCentral African RepublicCentral Europe and the BalticsChadChileChinaColombiaComorosCongo, Dem. Rep.Congo, Rep.Costa RicaCote d'IvoireCroatiaCubaCyprusCzech RepublicDenmarkDjiboutiDominicaDominican RepublicEarly-demographic dividendEast Asia & PacificEast Asia & Pacific (excluding high income)East Asia & Pacific (IDA & IBRD countries)EcuadorEgypt, Arab Rep.El SalvadorEquatorial GuineaEritreaEstoniaEthiopiaEuro areaEurope & Central AsiaEurope & Central Asia (excluding high income)Europe & Central Asia (IDA & IBRD countries)European UnionFaroe IslandsFijiFinlandFragile and conflict affected situationsFranceGabonGambia, TheGeorgiaGermanyGhanaGreeceGrenadaGuatemalaGuineaGuinea-BissauGuyanaHeavily indebted poor countries (HIPC)High incomeHondurasHong Kong SAR, ChinaHungaryIBRD onlyIcelandIDA & IBRD totalIDA blendIDA onlyIDA totalIndiaIndonesiaIran, Islamic Rep.IraqIrelandItalyJamaicaJapanJordanKazakhstanKenyaKiribatiKorea, Rep.KosovoKuwaitKyrgyz RepublicLao PDRLate-demographic dividendLatin America & Caribbean Latin America & Caribbean (excluding high income)Latin America & the Caribbean (IDA & IBRD countries)LatviaLeast developed countries: UN classificationLebanonLesothoLiberiaLibyaLithuaniaLow & middle incomeLow incomeLower middle incomeLuxembourgMacao SAR, ChinaMacedonia, FYRMadagascarMalawiMalaysiaMaldivesMaliMaltaMarshall IslandsMauritaniaMauritiusMexicoMicronesia, Fed. Sts.Middle East & North AfricaMiddle East & North Africa (excluding high income)Middle East & North Africa (IDA & IBRD countries)Middle incomeMoldovaMongoliaMontenegroMoroccoMozambiqueMyanmarNamibiaNepalNetherlandsNew CaledoniaNew ZealandNicaraguaNigerNigeriaNorth AmericaNorwayOECD membersOmanOther small statesPacific island small statesPakistanPalauPanamaPapua New GuineaParaguayPeruPhilippinesPolandPortugalPost-demographic dividendPre-demographic dividendPuerto RicoQatarRomaniaRussian FederationRwandaSamoaSao Tome and PrincipeSaudi ArabiaSenegalSerbiaSeychellesSierra LeoneSingaporeSlovak RepublicSloveniaSmall statesSolomon IslandsSouth AfricaSouth AsiaSouth Asia (IDA & IBRD)SpainSri LankaSt. Kitts and NevisSt. LuciaSt. Vincent and the GrenadinesSub-Saharan Africa Sub-Saharan Africa (excluding high income)Sub-Saharan Africa (IDA & IBRD countries)SudanSurinameSwazilandSwedenSwitzerlandSyrian Arab RepublicTajikistanTanzaniaThailandTimor-LesteTogoTongaTrinidad and TobagoTunisiaTurkeyTurkmenistanTuvaluUgandaUkraineUnited Arab EmiratesUnited KingdomUnited StatesUpper middle incomeUruguayUzbekistanVanuatuVenezuela, RBVietnamWest Bank and GazaWorldYemen, Rep.ZambiaZimbabwe Timeline:
This timeline shows a graph from 1961 to 2016 of Peru. No data until 1960. Number of actual observations by date: 45.
Source name:
World Development Indicators
Source organization:
World Bank national accounts data, and OECD National Accounts data files.
Categories, topics:
Economy & Growth
Last updated:
apr 23, 2017
Indicators value changes by year
Minimum:
465.113 mln
jan 1, 1961
Maximum:
29.828 bln
jan 1, 2014
At the date of observation
Value
Absolute change
Change from previous value
jan 1, 1961
465.113 mln
+465.113 mln
0.0%
jan 1, 1962
524.875 mln
+59.762 mln
12.85%
jan 1, 1963
600.54 mln
+75.665 mln
14.42%
jan 1, 1964
603.669 mln
+3.128 mln
0.52%
jan 1, 1965
707.97 mln
+104.301 mln
17.28%
jan 1, 1966
792.883 mln
+84.913 mln
11.99%
jan 1, 1967
861.302 mln
+68.419 mln
8.63%
jan 1, 1968
958.578 mln
+97.277 mln
11.29%
jan 1, 1969
922.721 mln
-35.857 mln
-3.74%
jan 1, 1970
1.02 bln
+97.623 mln
10.58%
jan 1, 1971
1.316 bln
+295.636 mln
28.97%
jan 1, 1972
1.532 bln
+216.489 mln
16.45%
jan 1, 1973
1.67 bln
+137.675 mln
8.98%
jan 1, 1974
2.047 bln
+377.008 mln
22.57%
jan 1, 1975
2.756 bln
+708.522 mln
34.61%
jan 1, 1976
3.065 bln
+309.632 mln
11.24%
jan 1, 1977
3.155 bln
+90.095 mln
2.94%
jan 1, 1978
5.44 bln
+2.285 bln
72.4%
jan 1, 1979
2.528 bln
-2.912 bln
-53.53%
jan 1, 1980
3.137 bln
+609.337 mln
24.1%
jan 1, 1992
5.545 bln
+2.407 bln
76.72%
jan 1, 1993
5.808 bln
+263.513 mln
4.75%
jan 1, 1994
5.639 bln
-168.729 mln
-2.91%
jan 1, 1995
7.181 bln
+1.542 bln
27.34%
jan 1, 1996
8.175 bln
+994.073 mln
13.84%
jan 1, 1997
8.459 bln
+283.253 mln
3.46%
jan 1, 1998
8.929 bln
+470.43 mln
5.56%
jan 1, 1999
8.25 bln
-678.9 mln
-7.6%
jan 1, 2000
7.364 bln
-885.993 mln
-10.74%
jan 1, 2001
7.873 bln
+508.558 mln
6.91%
jan 1, 2002
8.107 bln
+234.234 mln
2.98%
jan 1, 2003
8.49 bln
+382.97 mln
4.72%
jan 1, 2004
9.044 bln
+553.823 mln
6.52%
jan 1, 2005
10.932 bln
+1.888 bln
20.88%
jan 1, 2006
12.589 bln
+1.657 bln
15.16%
jan 1, 2007
14.601 bln
+2.012 bln
15.98%
jan 1, 2008
16.877 bln
+2.275 bln
15.58%
jan 1, 2009
19.646 bln
+2.769 bln
16.41%
jan 1, 2010
18.478 bln
-1.168 bln
-5.95%
jan 1, 2011
22.945 bln
+4.467 bln
24.18%
jan 1, 2012
25.916 bln
+2.971 bln
12.95%
jan 1, 2013
29.207 bln
+3.292 bln
12.7%
jan 1, 2014
29.828 bln
+620.172 mln
2.12%
jan 1, 2015
28.017 bln
-1.81 bln
-6.07%
jan 1, 2016
24.952 bln
-3.065 bln
-10.94%
Ranking of countries by current statistics by years


Comments: