29
/
en
AIzaSyAYiBZKx7MnpbEhh9jyipgxe19OcubqV5w
April 1, 2024
157550
Iran, Islamic Rep.
IRN
true
2
1
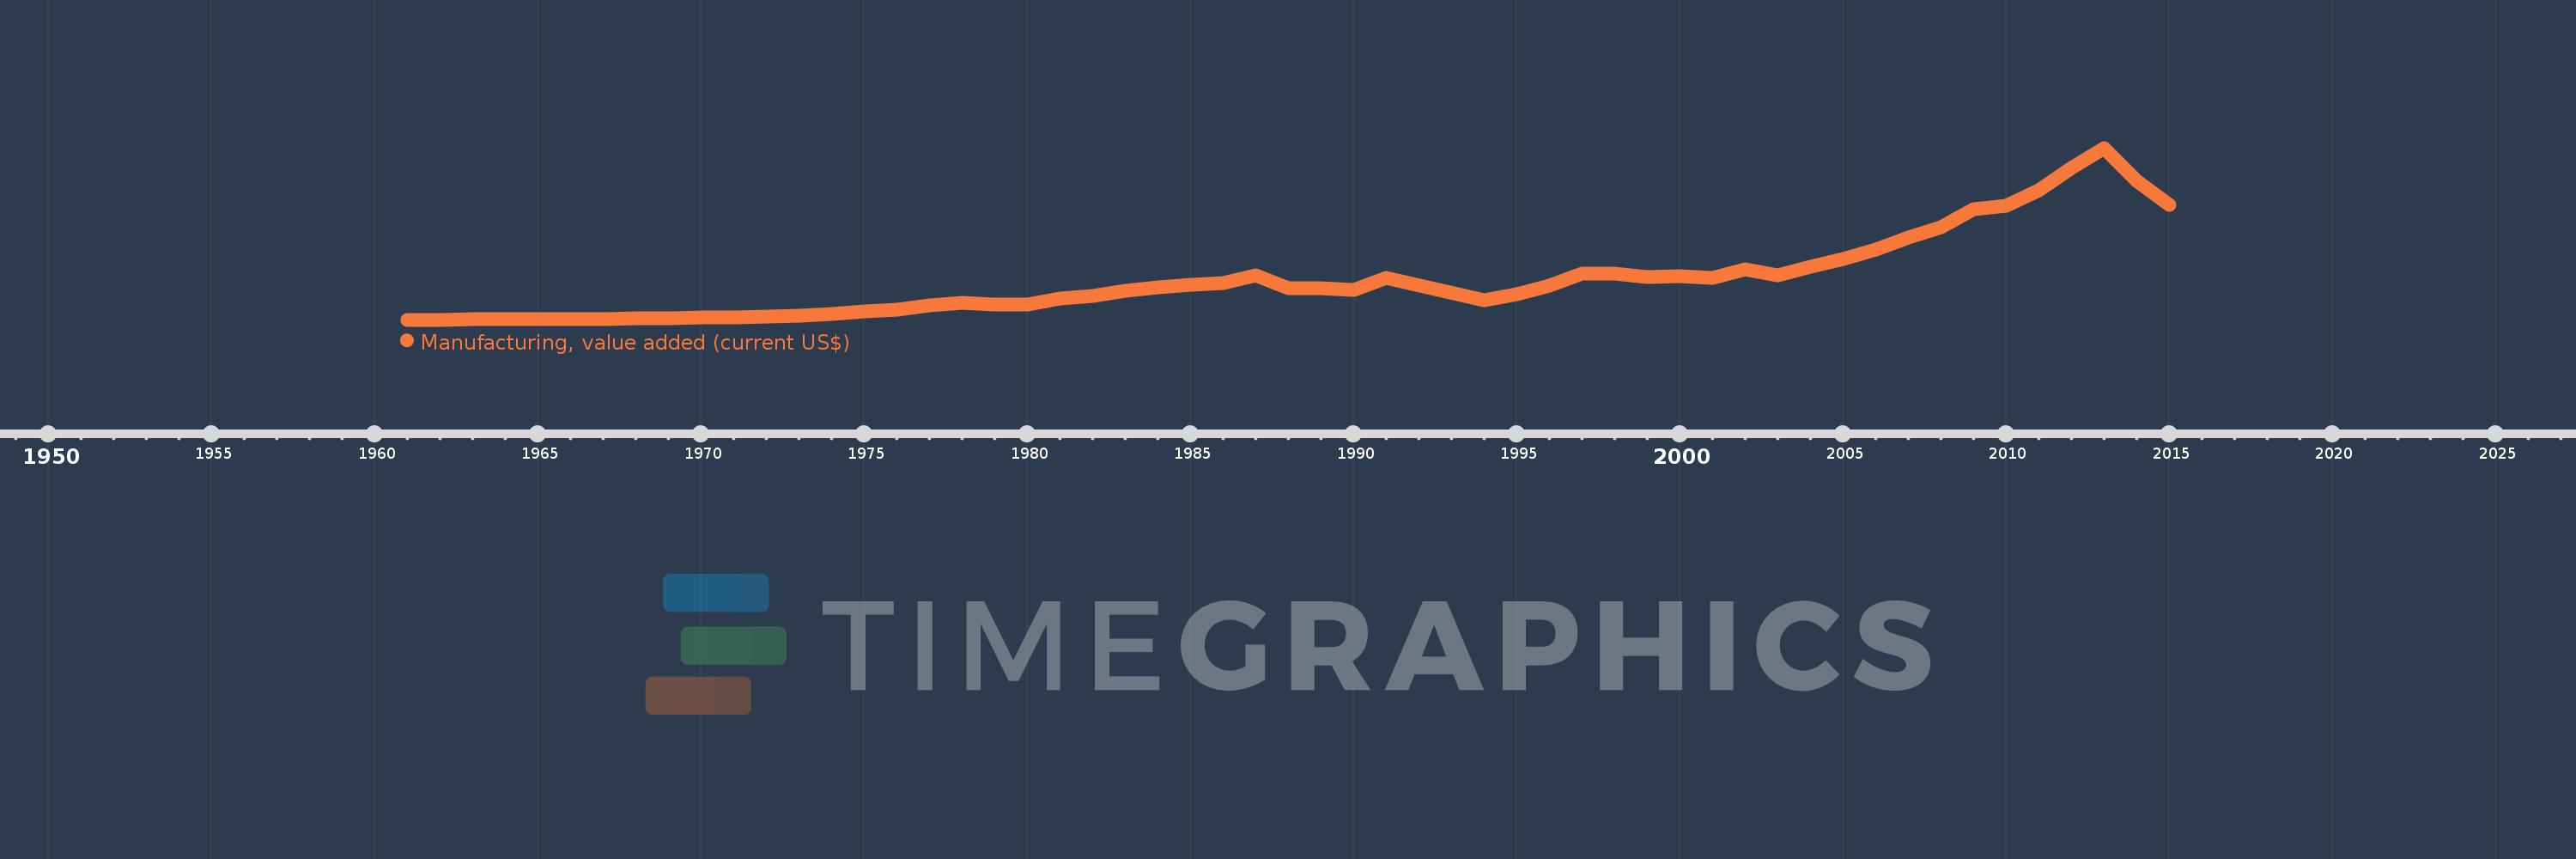
Manufacturing, value added (current US$)
2015,2014,2013,2012,2011,2010,2009,2008,2007,2006,2005,2004,2003,2002,2001,2000,1999,1998,1997,1996,1995,1994,1991,1990,1989,1988,1987,1986,1985,1984,1983,1982,1981,1980,1979,1978,1977,1976,1975,1974,1973,1972,1971,1970,1969,1968,1967,1966,1965,1964,1963,1962,1961
This statistics in other country:
AfghanistanAlbaniaAlgeriaAndorraAngolaAntigua and BarbudaArab WorldArgentinaArmeniaArubaAustraliaAustriaAzerbaijanBahamas, TheBahrainBangladeshBarbadosBelarusBelgiumBelizeBeninBermudaBhutanBoliviaBosnia and HerzegovinaBotswanaBrazilBrunei DarussalamBurkina FasoBurundiCabo VerdeCambodiaCameroonCanadaCaribbean small statesCayman IslandsCentral African RepublicCentral Europe and the BalticsChadChileChinaColombiaComorosCongo, Dem. Rep.Congo, Rep.Costa RicaCote d'IvoireCroatiaCubaCyprusCzech RepublicDenmarkDjiboutiDominicaDominican RepublicEarly-demographic dividendEast Asia & PacificEast Asia & Pacific (excluding high income)East Asia & Pacific (IDA & IBRD countries)EcuadorEgypt, Arab Rep.El SalvadorEquatorial GuineaEritreaEstoniaEthiopiaEuro areaEurope & Central AsiaEurope & Central Asia (excluding high income)Europe & Central Asia (IDA & IBRD countries)European UnionFaroe IslandsFijiFinlandFragile and conflict affected situationsFranceGabonGambia, TheGeorgiaGermanyGhanaGreeceGrenadaGuatemalaGuineaGuinea-BissauGuyanaHeavily indebted poor countries (HIPC)High incomeHondurasHong Kong SAR, ChinaHungaryIBRD onlyIcelandIDA & IBRD totalIDA blendIDA onlyIDA totalIndiaIndonesiaIran, Islamic Rep.IraqIrelandItalyJamaicaJapanJordanKazakhstanKenyaKiribatiKorea, Rep.KosovoKuwaitKyrgyz RepublicLao PDRLate-demographic dividendLatin America & Caribbean Latin America & Caribbean (excluding high income)Latin America & the Caribbean (IDA & IBRD countries)LatviaLeast developed countries: UN classificationLebanonLesothoLiberiaLibyaLithuaniaLow & middle incomeLow incomeLower middle incomeLuxembourgMacao SAR, ChinaMacedonia, FYRMadagascarMalawiMalaysiaMaldivesMaliMaltaMarshall IslandsMauritaniaMauritiusMexicoMicronesia, Fed. Sts.Middle East & North AfricaMiddle East & North Africa (excluding high income)Middle East & North Africa (IDA & IBRD countries)Middle incomeMoldovaMongoliaMontenegroMoroccoMozambiqueMyanmarNamibiaNepalNetherlandsNew CaledoniaNew ZealandNicaraguaNigerNigeriaNorth AmericaNorwayOECD membersOmanOther small statesPacific island small statesPakistanPalauPanamaPapua New GuineaParaguayPeruPhilippinesPolandPortugalPost-demographic dividendPre-demographic dividendPuerto RicoQatarRomaniaRussian FederationRwandaSamoaSao Tome and PrincipeSaudi ArabiaSenegalSerbiaSeychellesSierra LeoneSingaporeSlovak RepublicSloveniaSmall statesSolomon IslandsSouth AfricaSouth AsiaSouth Asia (IDA & IBRD)SpainSri LankaSt. Kitts and NevisSt. LuciaSt. Vincent and the GrenadinesSub-Saharan Africa Sub-Saharan Africa (excluding high income)Sub-Saharan Africa (IDA & IBRD countries)SudanSurinameSwazilandSwedenSwitzerlandSyrian Arab RepublicTajikistanTanzaniaThailandTimor-LesteTogoTongaTrinidad and TobagoTunisiaTurkeyTurkmenistanTuvaluUgandaUkraineUnited Arab EmiratesUnited KingdomUnited StatesUpper middle incomeUruguayUzbekistanVanuatuVenezuela, RBVietnamWest Bank and GazaWorldYemen, Rep.ZambiaZimbabwe Timeline:
This timeline shows a graph from 1961 to 2015 of Iran, Islamic Rep.. No data until 1960. Number of actual observations by date: 53.
Source name:
World Development Indicators
Source organization:
World Bank national accounts data, and OECD National Accounts data files.
Categories, topics:
Economy & Growth
Last updated:
apr 23, 2017
Indicators value changes by year
Minimum:
358.711 mln
jan 1, 1961
Maximum:
73.405 bln
jan 1, 2013
At the date of observation
Value
Absolute change
Change from previous value
jan 1, 1961
358.711 mln
+358.711 mln
0.0%
jan 1, 1962
394.439 mln
+35.728 mln
9.96%
jan 1, 1963
467.325 mln
+72.886 mln
18.48%
jan 1, 1964
511.628 mln
+44.303 mln
9.48%
jan 1, 1965
570.222 mln
+58.594 mln
11.45%
jan 1, 1966
670.261 mln
+100.039 mln
17.54%
jan 1, 1967
768.871 mln
+98.61 mln
14.71%
jan 1, 1968
893.205 mln
+124.334 mln
16.17%
jan 1, 1969
1.035 bln
+141.484 mln
15.84%
jan 1, 1970
1.22 bln
+185.787 mln
17.96%
jan 1, 1971
1.363 bln
+142.913 mln
11.71%
jan 1, 1972
1.636 bln
+272.963 mln
20.02%
jan 1, 1973
2.008 bln
+371.573 mln
22.71%
jan 1, 1974
2.975 bln
+967.155 mln
48.17%
jan 1, 1975
4.037 bln
+1.062 bln
35.7%
jan 1, 1976
4.718 bln
+681.028 mln
16.87%
jan 1, 1977
6.408 bln
+1.689 bln
35.81%
jan 1, 1978
7.411 bln
+1.004 bln
15.66%
jan 1, 1979
6.883 bln
-528.233 mln
-7.13%
jan 1, 1980
6.748 bln
-135.177 mln
-1.96%
jan 1, 1981
9.275 bln
+2.527 bln
37.44%
jan 1, 1982
10.623 bln
+1.349 bln
14.54%
jan 1, 1983
12.776 bln
+2.153 bln
20.27%
jan 1, 1984
14.171 bln
+1.394 bln
10.91%
jan 1, 1985
15.363 bln
+1.192 bln
8.41%
jan 1, 1986
15.993 bln
+630.083 mln
4.1%
jan 1, 1987
19.152 bln
+3.159 bln
19.76%
jan 1, 1988
13.725 bln
-5.427 bln
-28.34%
jan 1, 1989
13.918 bln
+193.181 mln
1.41%
jan 1, 1990
13.153 bln
-765.481 mln
-5.5%
jan 1, 1991
18.113 bln
+4.961 bln
37.72%
jan 1, 1994
8.646 bln
-9.467 bln
-52.27%
jan 1, 1995
11.144 bln
+2.498 bln
28.89%
jan 1, 1996
14.795 bln
+3.65 bln
32.76%
jan 1, 1997
19.873 bln
+5.078 bln
34.33%
jan 1, 1998
19.863 bln
-10.398 mln
-0.05%
jan 1, 1999
18.627 bln
-1.236 bln
-6.22%
jan 1, 2000
18.967 bln
+340.581 mln
1.83%
jan 1, 2001
18.235 bln
-731.927 mln
-3.86%
jan 1, 2002
21.757 bln
+3.522 bln
19.31%
jan 1, 2003
19.418 bln
-2.339 bln
-10.75%
jan 1, 2004
22.714 bln
+3.296 bln
16.97%
jan 1, 2005
26.333 bln
+3.619 bln
15.93%
jan 1, 2006
30.057 bln
+3.724 bln
14.14%
jan 1, 2007
35.327 bln
+5.27 bln
17.53%
jan 1, 2008
39.855 bln
+4.528 bln
12.82%
jan 1, 2009
47.191 bln
+7.336 bln
18.41%
jan 1, 2010
48.782 bln
+1.59 bln
3.37%
jan 1, 2011
55.409 bln
+6.627 bln
13.59%
jan 1, 2012
64.927 bln
+9.518 bln
17.18%
jan 1, 2013
73.405 bln
+8.478 bln
13.06%
jan 1, 2014
59.244 bln
-14.16 bln
-19.29%
jan 1, 2015
49.286 bln
-9.959 bln
-16.81%
Ranking of countries by current statistics by years


Comments: