29
/
en
AIzaSyAYiBZKx7MnpbEhh9jyipgxe19OcubqV5w
April 1, 2024
41651
Latin America & Caribbean
LCN
false
2
1
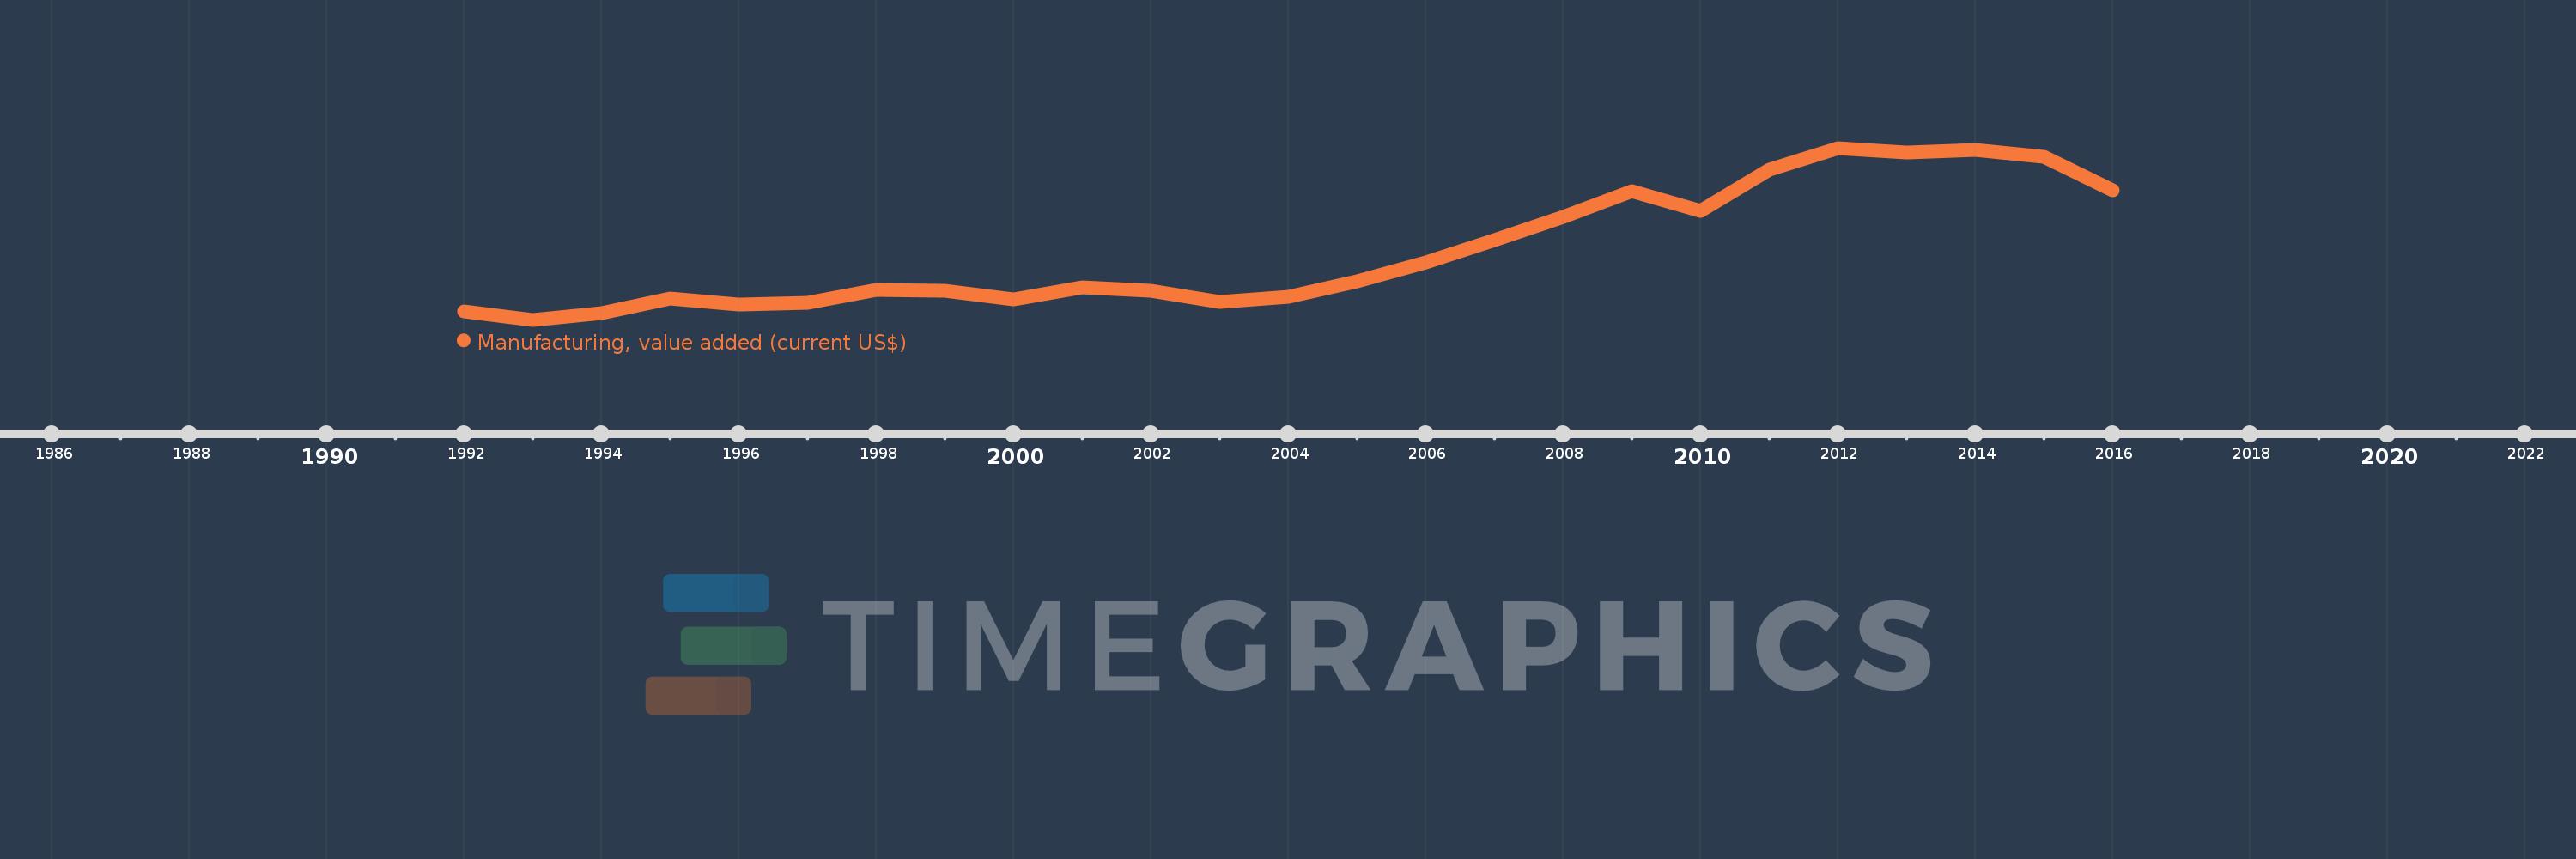
Manufacturing, value added (current US$)
2016,2015,2014,2013,2012,2011,2010,2009,2008,2007,2006,2005,2004,2003,2002,2001,2000,1999,1998,1997,1996,1995,1994,1993,1992
This statistics in other country:
AfghanistanAlbaniaAlgeriaAndorraAngolaAntigua and BarbudaArab WorldArgentinaArmeniaArubaAustraliaAustriaAzerbaijanBahamas, TheBahrainBangladeshBarbadosBelarusBelgiumBelizeBeninBermudaBhutanBoliviaBosnia and HerzegovinaBotswanaBrazilBrunei DarussalamBurkina FasoBurundiCabo VerdeCambodiaCameroonCanadaCaribbean small statesCayman IslandsCentral African RepublicCentral Europe and the BalticsChadChileChinaColombiaComorosCongo, Dem. Rep.Congo, Rep.Costa RicaCote d'IvoireCroatiaCubaCyprusCzech RepublicDenmarkDjiboutiDominicaDominican RepublicEarly-demographic dividendEast Asia & PacificEast Asia & Pacific (excluding high income)East Asia & Pacific (IDA & IBRD countries)EcuadorEgypt, Arab Rep.El SalvadorEquatorial GuineaEritreaEstoniaEthiopiaEuro areaEurope & Central AsiaEurope & Central Asia (excluding high income)Europe & Central Asia (IDA & IBRD countries)European UnionFaroe IslandsFijiFinlandFragile and conflict affected situationsFranceGabonGambia, TheGeorgiaGermanyGhanaGreeceGrenadaGuatemalaGuineaGuinea-BissauGuyanaHeavily indebted poor countries (HIPC)High incomeHondurasHong Kong SAR, ChinaHungaryIBRD onlyIcelandIDA & IBRD totalIDA blendIDA onlyIDA totalIndiaIndonesiaIran, Islamic Rep.IraqIrelandItalyJamaicaJapanJordanKazakhstanKenyaKiribatiKorea, Rep.KosovoKuwaitKyrgyz RepublicLao PDRLate-demographic dividendLatin America & Caribbean Latin America & Caribbean (excluding high income)Latin America & the Caribbean (IDA & IBRD countries)LatviaLeast developed countries: UN classificationLebanonLesothoLiberiaLibyaLithuaniaLow & middle incomeLow incomeLower middle incomeLuxembourgMacao SAR, ChinaMacedonia, FYRMadagascarMalawiMalaysiaMaldivesMaliMaltaMarshall IslandsMauritaniaMauritiusMexicoMicronesia, Fed. Sts.Middle East & North AfricaMiddle East & North Africa (excluding high income)Middle East & North Africa (IDA & IBRD countries)Middle incomeMoldovaMongoliaMontenegroMoroccoMozambiqueMyanmarNamibiaNepalNetherlandsNew CaledoniaNew ZealandNicaraguaNigerNigeriaNorth AmericaNorwayOECD membersOmanOther small statesPacific island small statesPakistanPalauPanamaPapua New GuineaParaguayPeruPhilippinesPolandPortugalPost-demographic dividendPre-demographic dividendPuerto RicoQatarRomaniaRussian FederationRwandaSamoaSao Tome and PrincipeSaudi ArabiaSenegalSerbiaSeychellesSierra LeoneSingaporeSlovak RepublicSloveniaSmall statesSolomon IslandsSouth AfricaSouth AsiaSouth Asia (IDA & IBRD)SpainSri LankaSt. Kitts and NevisSt. LuciaSt. Vincent and the GrenadinesSub-Saharan Africa Sub-Saharan Africa (excluding high income)Sub-Saharan Africa (IDA & IBRD countries)SudanSurinameSwazilandSwedenSwitzerlandSyrian Arab RepublicTajikistanTanzaniaThailandTimor-LesteTogoTongaTrinidad and TobagoTunisiaTurkeyTurkmenistanTuvaluUgandaUkraineUnited Arab EmiratesUnited KingdomUnited StatesUpper middle incomeUruguayUzbekistanVanuatuVenezuela, RBVietnamWest Bank and GazaWorldYemen, Rep.ZambiaZimbabwe Timeline:
This timeline shows a graph from 1992 to 2016 of Latin America & Caribbean . No data until 1991. Number of actual observations by date: 25.
Source name:
World Development Indicators
Source organization:
World Bank national accounts data, and OECD National Accounts data files.
Categories, topics:
Economy & Growth
Last updated:
apr 23, 2017
Indicators value changes by year
Minimum:
273.131 bln
jan 1, 1993
Maximum:
831.329 bln
jan 1, 2012
At the date of observation
Value
Absolute change
Change from previous value
jan 1, 1992
301.143 bln
+301.143 bln
0.0%
jan 1, 1993
273.131 bln
-28.012 bln
-9.3%
jan 1, 1994
295.947 bln
+22.816 bln
8.35%
jan 1, 1995
340.848 bln
+44.901 bln
15.17%
jan 1, 1996
322.317 bln
-18.531 bln
-5.44%
jan 1, 1997
329.279 bln
+6.962 bln
2.16%
jan 1, 1998
370.893 bln
+41.614 bln
12.64%
jan 1, 1999
367.806 bln
-3.087 bln
-0.83%
jan 1, 2000
339.532 bln
-28.274 bln
-7.69%
jan 1, 2001
378.524 bln
+38.992 bln
11.48%
jan 1, 2002
368.542 bln
-9.982 bln
-2.64%
jan 1, 2003
330.161 bln
-38.381 bln
-10.41%
jan 1, 2004
347.11 bln
+16.948 bln
5.13%
jan 1, 2005
397.163 bln
+50.054 bln
14.42%
jan 1, 2006
459.339 bln
+62.176 bln
15.66%
jan 1, 2007
530.849 bln
+71.51 bln
15.57%
jan 1, 2008
606.611 bln
+75.762 bln
14.27%
jan 1, 2009
690.117 bln
+83.506 bln
13.77%
jan 1, 2010
625.628 bln
-64.49 bln
-9.34%
jan 1, 2011
760.215 bln
+134.588 bln
21.51%
jan 1, 2012
831.329 bln
+71.114 bln
9.35%
jan 1, 2013
817.275 bln
-14.054 bln
-1.69%
jan 1, 2014
825.24 bln
+7.965 bln
0.97%
jan 1, 2015
802.386 bln
-22.855 bln
-2.77%
jan 1, 2016
692.973 bln
-109.413 bln
-13.64%
Ranking of countries by current statistics by years


Comments: