29
/
en
AIzaSyAYiBZKx7MnpbEhh9jyipgxe19OcubqV5w
April 1, 2024
211965
Niger
NER
true
2
1
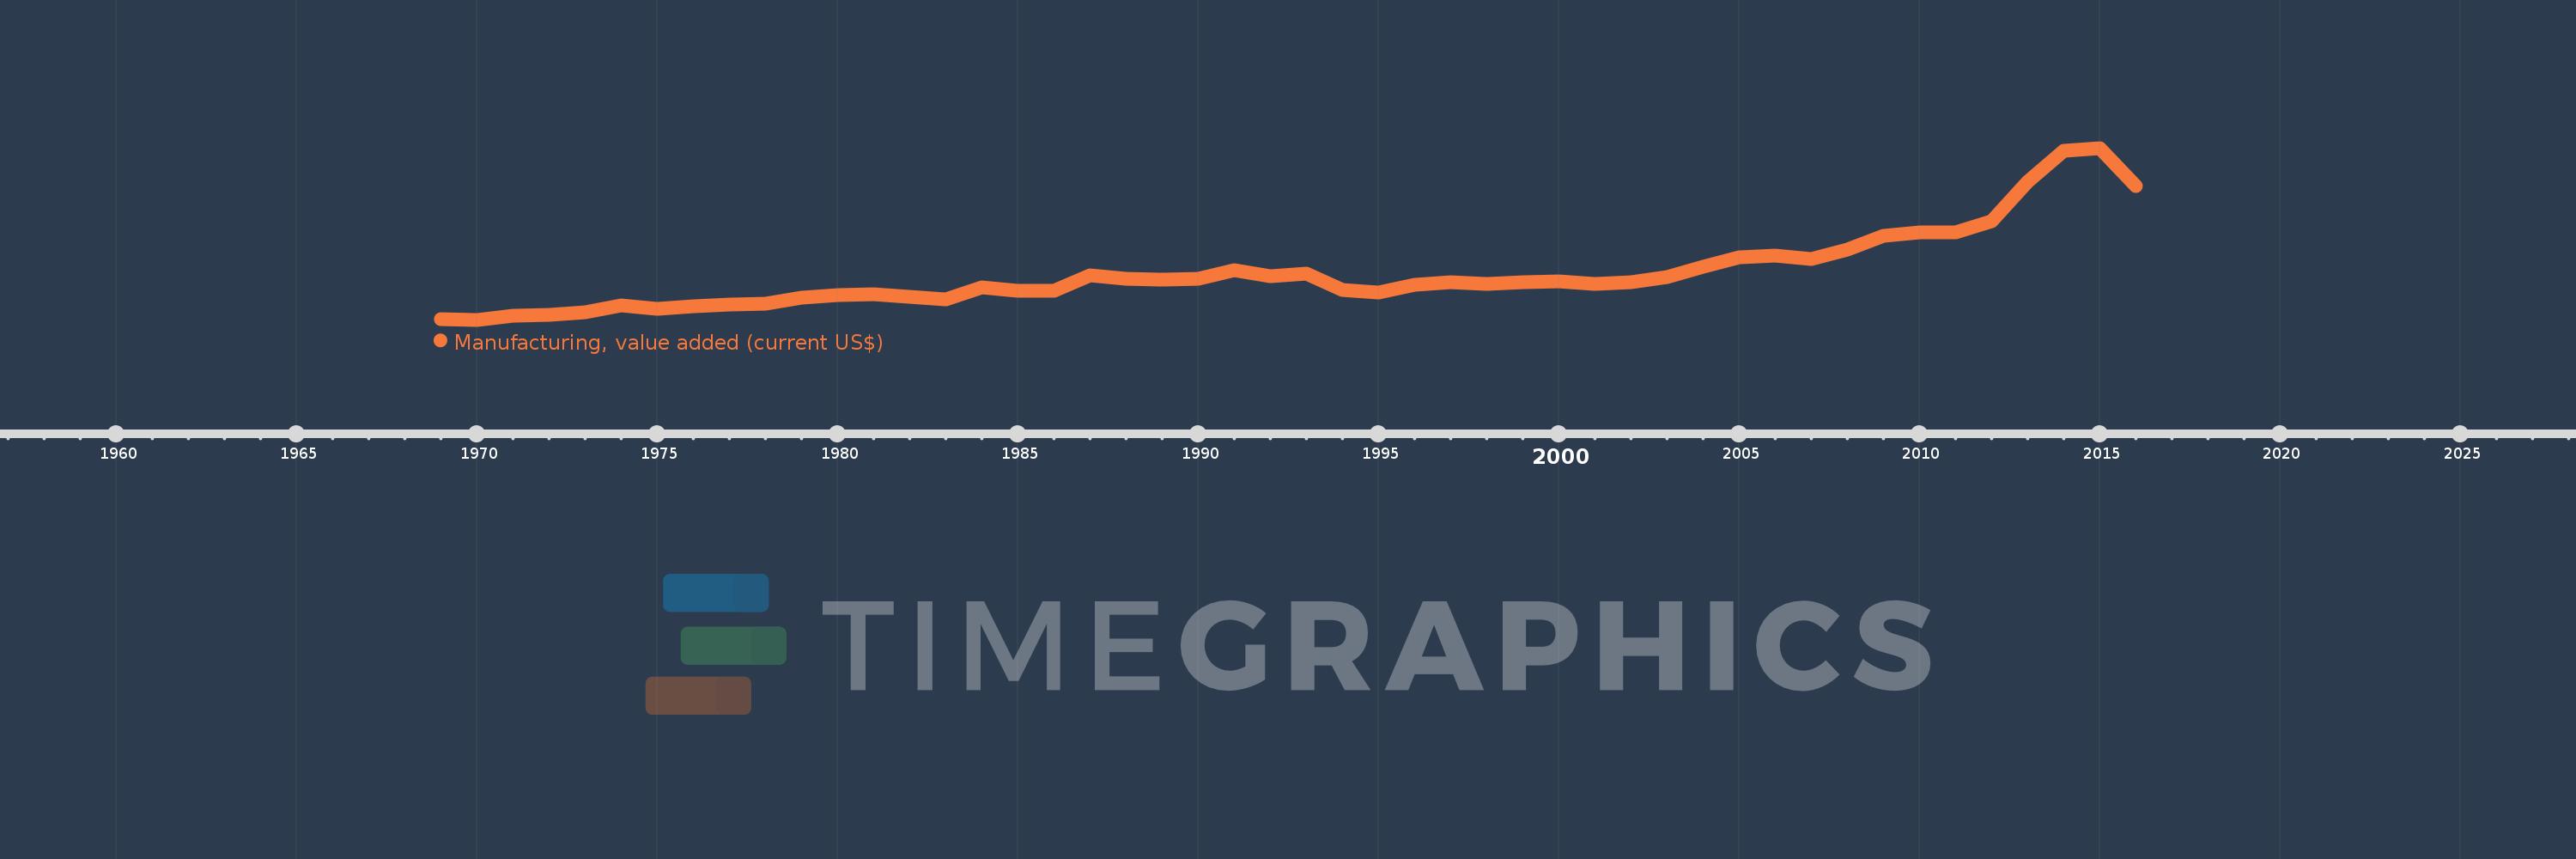
Manufacturing, value added (current US$)
2016,2015,2014,2013,2012,2011,2010,2009,2008,2007,2006,2005,2004,2003,2002,2001,2000,1999,1998,1997,1996,1995,1994,1993,1992,1991,1990,1989,1988,1987,1986,1985,1984,1983,1982,1981,1980,1979,1978,1977,1976,1975,1974,1973,1972,1971,1970,1969
This statistics in other country:
AfghanistanAlbaniaAlgeriaAndorraAngolaAntigua and BarbudaArab WorldArgentinaArmeniaArubaAustraliaAustriaAzerbaijanBahamas, TheBahrainBangladeshBarbadosBelarusBelgiumBelizeBeninBermudaBhutanBoliviaBosnia and HerzegovinaBotswanaBrazilBrunei DarussalamBurkina FasoBurundiCabo VerdeCambodiaCameroonCanadaCaribbean small statesCayman IslandsCentral African RepublicCentral Europe and the BalticsChadChileChinaColombiaComorosCongo, Dem. Rep.Congo, Rep.Costa RicaCote d'IvoireCroatiaCubaCyprusCzech RepublicDenmarkDjiboutiDominicaDominican RepublicEarly-demographic dividendEast Asia & PacificEast Asia & Pacific (excluding high income)East Asia & Pacific (IDA & IBRD countries)EcuadorEgypt, Arab Rep.El SalvadorEquatorial GuineaEritreaEstoniaEthiopiaEuro areaEurope & Central AsiaEurope & Central Asia (excluding high income)Europe & Central Asia (IDA & IBRD countries)European UnionFaroe IslandsFijiFinlandFragile and conflict affected situationsFranceGabonGambia, TheGeorgiaGermanyGhanaGreeceGrenadaGuatemalaGuineaGuinea-BissauGuyanaHeavily indebted poor countries (HIPC)High incomeHondurasHong Kong SAR, ChinaHungaryIBRD onlyIcelandIDA & IBRD totalIDA blendIDA onlyIDA totalIndiaIndonesiaIran, Islamic Rep.IraqIrelandItalyJamaicaJapanJordanKazakhstanKenyaKiribatiKorea, Rep.KosovoKuwaitKyrgyz RepublicLao PDRLate-demographic dividendLatin America & Caribbean Latin America & Caribbean (excluding high income)Latin America & the Caribbean (IDA & IBRD countries)LatviaLeast developed countries: UN classificationLebanonLesothoLiberiaLibyaLithuaniaLow & middle incomeLow incomeLower middle incomeLuxembourgMacao SAR, ChinaMacedonia, FYRMadagascarMalawiMalaysiaMaldivesMaliMaltaMarshall IslandsMauritaniaMauritiusMexicoMicronesia, Fed. Sts.Middle East & North AfricaMiddle East & North Africa (excluding high income)Middle East & North Africa (IDA & IBRD countries)Middle incomeMoldovaMongoliaMontenegroMoroccoMozambiqueMyanmarNamibiaNepalNetherlandsNew CaledoniaNew ZealandNicaraguaNigerNigeriaNorth AmericaNorwayOECD membersOmanOther small statesPacific island small statesPakistanPalauPanamaPapua New GuineaParaguayPeruPhilippinesPolandPortugalPost-demographic dividendPre-demographic dividendPuerto RicoQatarRomaniaRussian FederationRwandaSamoaSao Tome and PrincipeSaudi ArabiaSenegalSerbiaSeychellesSierra LeoneSingaporeSlovak RepublicSloveniaSmall statesSolomon IslandsSouth AfricaSouth AsiaSouth Asia (IDA & IBRD)SpainSri LankaSt. Kitts and NevisSt. LuciaSt. Vincent and the GrenadinesSub-Saharan Africa Sub-Saharan Africa (excluding high income)Sub-Saharan Africa (IDA & IBRD countries)SudanSurinameSwazilandSwedenSwitzerlandSyrian Arab RepublicTajikistanTanzaniaThailandTimor-LesteTogoTongaTrinidad and TobagoTunisiaTurkeyTurkmenistanTuvaluUgandaUkraineUnited Arab EmiratesUnited KingdomUnited StatesUpper middle incomeUruguayUzbekistanVanuatuVenezuela, RBVietnamWest Bank and GazaWorldYemen, Rep.ZambiaZimbabwe Timeline:
This timeline shows a graph from 1969 to 2016 of Niger. No data until 1968. Number of actual observations by date: 48.
Source name:
World Development Indicators
Source organization:
World Bank national accounts data, and OECD National Accounts data files.
Categories, topics:
Economy & Growth
Last updated:
apr 23, 2017
Indicators value changes by year
Minimum:
18.365 mln
jan 1, 1970
Maximum:
518.305 mln
jan 1, 2015
At the date of observation
Value
Absolute change
Change from previous value
jan 1, 1969
19.897 mln
+19.897 mln
0.0%
jan 1, 1970
18.365 mln
-1.532 mln
-7.7%
jan 1, 1971
30.158 mln
+11.793 mln
64.22%
jan 1, 1972
33.3 mln
+3.142 mln
10.42%
jan 1, 1973
39.089 mln
+5.788 mln
17.38%
jan 1, 1974
59.838 mln
+20.75 mln
53.08%
jan 1, 1975
50.372 mln
-9.466 mln
-15.82%
jan 1, 1976
58.343 mln
+7.971 mln
15.82%
jan 1, 1977
62.159 mln
+3.816 mln
6.54%
jan 1, 1978
66.317 mln
+4.158 mln
6.69%
jan 1, 1979
81.94 mln
+15.623 mln
23.56%
jan 1, 1980
89.319 mln
+7.378 mln
9.0%
jan 1, 1981
93.715 mln
+4.396 mln
4.92%
jan 1, 1982
85.378 mln
-8.336 mln
-8.9%
jan 1, 1983
77.905 mln
-7.474 mln
-8.75%
jan 1, 1984
112.579 mln
+34.674 mln
44.51%
jan 1, 1985
102.527 mln
-10.052 mln
-8.93%
jan 1, 1986
102.835 mln
+307.768K
0.3%
jan 1, 1987
147.557 mln
+44.722 mln
43.49%
jan 1, 1988
137.754 mln
-9.804 mln
-6.64%
jan 1, 1989
134.632 mln
-3.121 mln
-2.27%
jan 1, 1990
136.674 mln
+2.041 mln
1.52%
jan 1, 1991
163.444 mln
+26.77 mln
19.59%
jan 1, 1992
144.626 mln
-18.818 mln
-11.51%
jan 1, 1993
151.632 mln
+7.006 mln
4.84%
jan 1, 1994
104.686 mln
-46.946 mln
-30.96%
jan 1, 1995
98.702 mln
-5.983 mln
-5.72%
jan 1, 1996
120.405 mln
+21.703 mln
21.99%
jan 1, 1997
128.628 mln
+8.223 mln
6.83%
jan 1, 1998
121.644 mln
-6.984 mln
-5.43%
jan 1, 1999
128.485 mln
+6.841 mln
5.62%
jan 1, 2000
131.071 mln
+2.585 mln
2.01%
jan 1, 2001
122.195 mln
-8.875 mln
-6.77%
jan 1, 2002
127.688 mln
+5.493 mln
4.49%
jan 1, 2003
143.044 mln
+15.356 mln
12.03%
jan 1, 2004
173.434 mln
+30.39 mln
21.25%
jan 1, 2005
199.198 mln
+25.764 mln
14.86%
jan 1, 2006
206.332 mln
+7.133 mln
3.58%
jan 1, 2007
196.284 mln
-10.048 mln
-4.87%
jan 1, 2008
222.377 mln
+26.093 mln
13.29%
jan 1, 2009
262.523 mln
+40.145 mln
18.05%
jan 1, 2010
271.622 mln
+9.099 mln
3.47%
jan 1, 2011
272.409 mln
+787.573K
0.29%
jan 1, 2012
305.048 mln
+32.639 mln
11.98%
jan 1, 2013
419.972 mln
+114.924 mln
37.67%
jan 1, 2014
510.513 mln
+90.541 mln
21.56%
jan 1, 2015
518.305 mln
+7.792 mln
1.53%
jan 1, 2016
408.755 mln
-109.55 mln
-21.14%
Ranking of countries by current statistics by years


Comments: