29
/
en
AIzaSyAYiBZKx7MnpbEhh9jyipgxe19OcubqV5w
April 1, 2024
184137
Macedonia, FYR
MKD
true
2
1
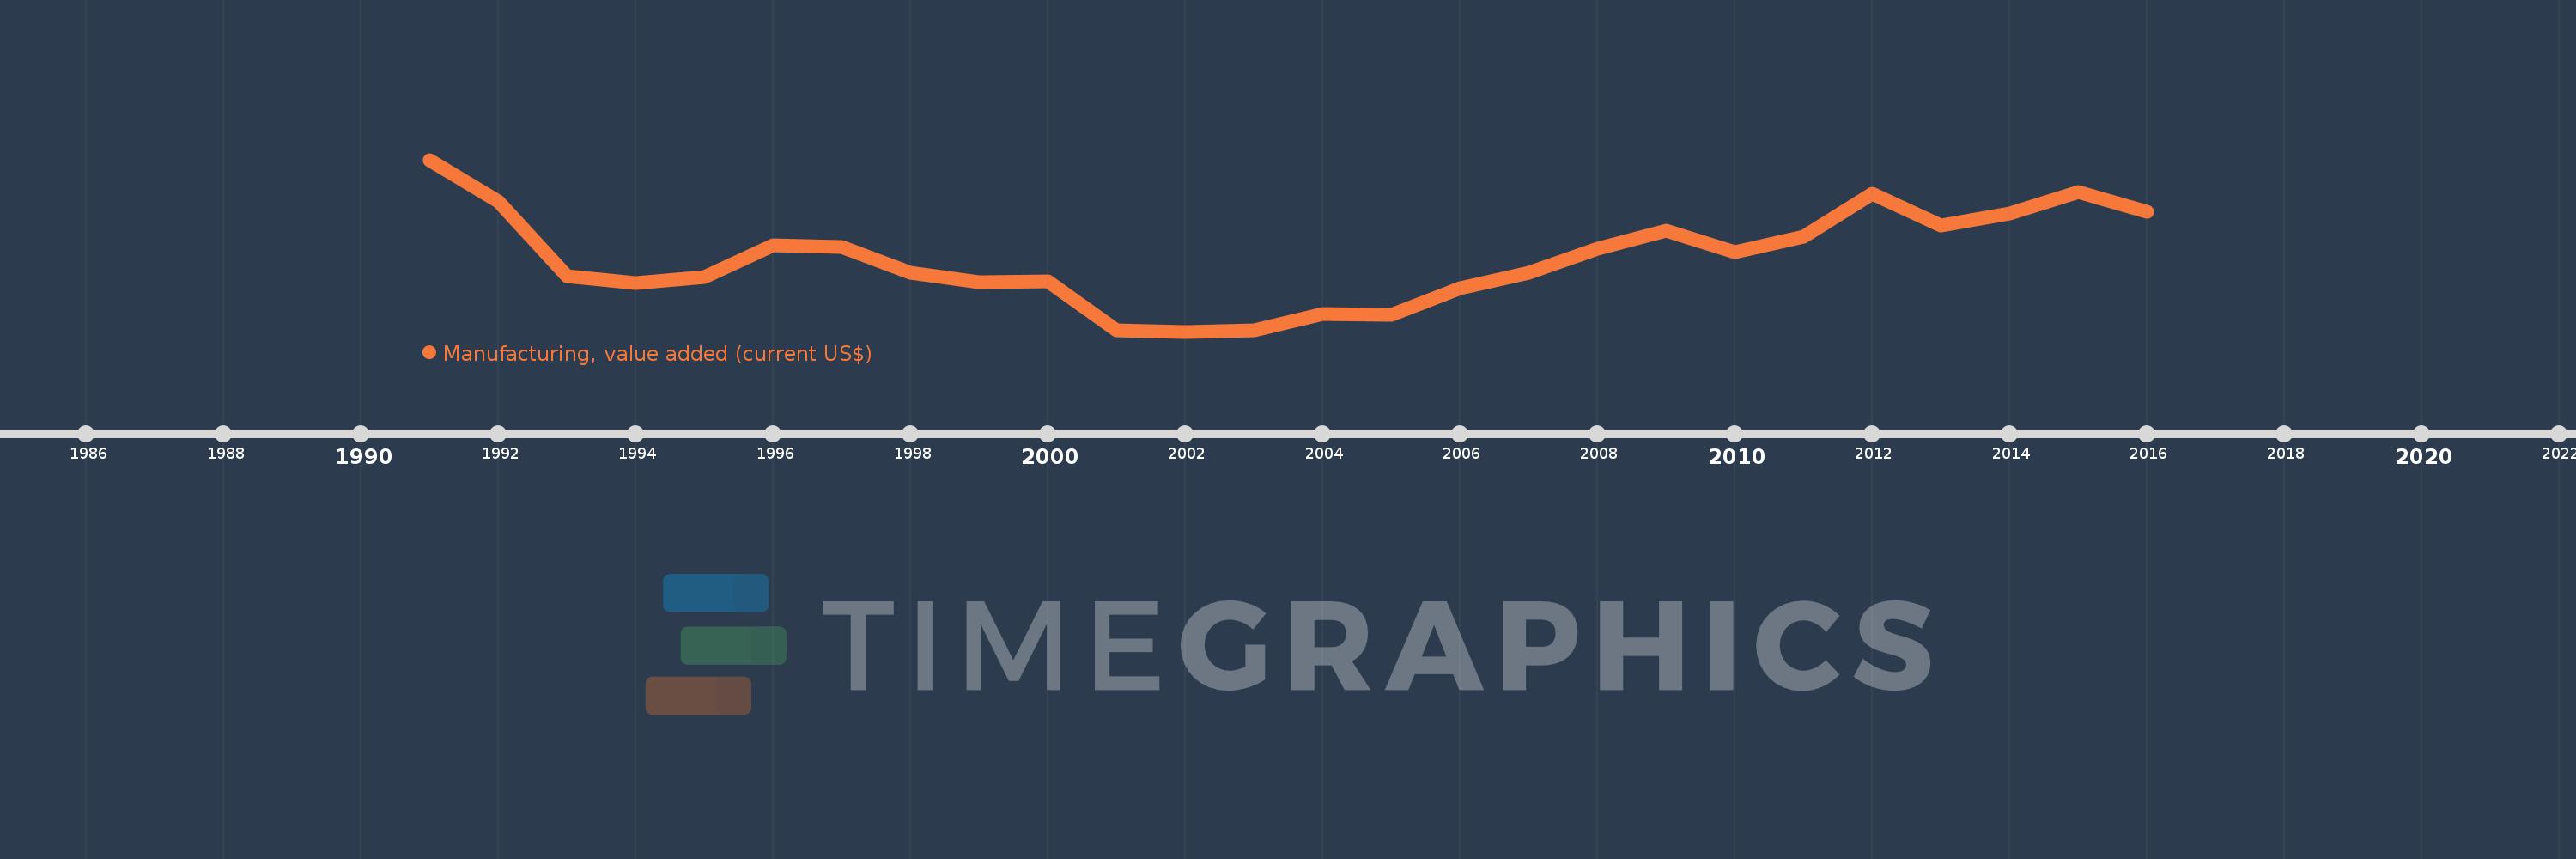
Manufacturing, value added (current US$)
2016,2015,2014,2013,2012,2011,2010,2009,2008,2007,2006,2005,2004,2003,2002,2001,2000,1999,1998,1997,1996,1995,1994,1993,1992,1991
This statistics in other country:
AfghanistanAlbaniaAlgeriaAndorraAngolaAntigua and BarbudaArab WorldArgentinaArmeniaArubaAustraliaAustriaAzerbaijanBahamas, TheBahrainBangladeshBarbadosBelarusBelgiumBelizeBeninBermudaBhutanBoliviaBosnia and HerzegovinaBotswanaBrazilBrunei DarussalamBurkina FasoBurundiCabo VerdeCambodiaCameroonCanadaCaribbean small statesCayman IslandsCentral African RepublicCentral Europe and the BalticsChadChileChinaColombiaComorosCongo, Dem. Rep.Congo, Rep.Costa RicaCote d'IvoireCroatiaCubaCyprusCzech RepublicDenmarkDjiboutiDominicaDominican RepublicEarly-demographic dividendEast Asia & PacificEast Asia & Pacific (excluding high income)East Asia & Pacific (IDA & IBRD countries)EcuadorEgypt, Arab Rep.El SalvadorEquatorial GuineaEritreaEstoniaEthiopiaEuro areaEurope & Central AsiaEurope & Central Asia (excluding high income)Europe & Central Asia (IDA & IBRD countries)European UnionFaroe IslandsFijiFinlandFragile and conflict affected situationsFranceGabonGambia, TheGeorgiaGermanyGhanaGreeceGrenadaGuatemalaGuineaGuinea-BissauGuyanaHeavily indebted poor countries (HIPC)High incomeHondurasHong Kong SAR, ChinaHungaryIBRD onlyIcelandIDA & IBRD totalIDA blendIDA onlyIDA totalIndiaIndonesiaIran, Islamic Rep.IraqIrelandItalyJamaicaJapanJordanKazakhstanKenyaKiribatiKorea, Rep.KosovoKuwaitKyrgyz RepublicLao PDRLate-demographic dividendLatin America & Caribbean Latin America & Caribbean (excluding high income)Latin America & the Caribbean (IDA & IBRD countries)LatviaLeast developed countries: UN classificationLebanonLesothoLiberiaLibyaLithuaniaLow & middle incomeLow incomeLower middle incomeLuxembourgMacao SAR, ChinaMacedonia, FYRMadagascarMalawiMalaysiaMaldivesMaliMaltaMarshall IslandsMauritaniaMauritiusMexicoMicronesia, Fed. Sts.Middle East & North AfricaMiddle East & North Africa (excluding high income)Middle East & North Africa (IDA & IBRD countries)Middle incomeMoldovaMongoliaMontenegroMoroccoMozambiqueMyanmarNamibiaNepalNetherlandsNew CaledoniaNew ZealandNicaraguaNigerNigeriaNorth AmericaNorwayOECD membersOmanOther small statesPacific island small statesPakistanPalauPanamaPapua New GuineaParaguayPeruPhilippinesPolandPortugalPost-demographic dividendPre-demographic dividendPuerto RicoQatarRomaniaRussian FederationRwandaSamoaSao Tome and PrincipeSaudi ArabiaSenegalSerbiaSeychellesSierra LeoneSingaporeSlovak RepublicSloveniaSmall statesSolomon IslandsSouth AfricaSouth AsiaSouth Asia (IDA & IBRD)SpainSri LankaSt. Kitts and NevisSt. LuciaSt. Vincent and the GrenadinesSub-Saharan Africa Sub-Saharan Africa (excluding high income)Sub-Saharan Africa (IDA & IBRD countries)SudanSurinameSwazilandSwedenSwitzerlandSyrian Arab RepublicTajikistanTanzaniaThailandTimor-LesteTogoTongaTrinidad and TobagoTunisiaTurkeyTurkmenistanTuvaluUgandaUkraineUnited Arab EmiratesUnited KingdomUnited StatesUpper middle incomeUruguayUzbekistanVanuatuVenezuela, RBVietnamWest Bank and GazaWorldYemen, Rep.ZambiaZimbabwe Timeline:
This timeline shows a graph from 1991 to 2016 of Macedonia, FYR. No data until 1990. Number of actual observations by date: 26.
Source name:
World Development Indicators
Source organization:
World Bank national accounts data, and OECD National Accounts data files.
Categories, topics:
Economy & Growth
Last updated:
apr 23, 2017
Indicators value changes by year
Minimum:
332.554 mln
jan 1, 2002
Maximum:
1.411 bln
jan 1, 1991
At the date of observation
Value
Absolute change
Change from previous value
jan 1, 1991
1.411 bln
+1.411 bln
0.0%
jan 1, 1992
1.148 bln
-262.974 mln
-18.64%
jan 1, 1993
680.401 mln
-467.155 mln
-40.71%
jan 1, 1994
639.331 mln
-41.07 mln
-6.04%
jan 1, 1995
672.488 mln
+33.157 mln
5.19%
jan 1, 1996
873.41 mln
+200.923 mln
29.88%
jan 1, 1997
861.901 mln
-11.51 mln
-1.32%
jan 1, 1998
704.396 mln
-157.504 mln
-18.27%
jan 1, 1999
644.717 mln
-59.679 mln
-8.47%
jan 1, 2000
646.115 mln
+1.398 mln
0.22%
jan 1, 2001
338.371 mln
-307.744 mln
-47.63%
jan 1, 2002
332.554 mln
-5.817 mln
-1.72%
jan 1, 2003
338.991 mln
+6.437 mln
1.94%
jan 1, 2004
441.771 mln
+102.78 mln
30.32%
jan 1, 2005
436.729 mln
-5.042 mln
-1.14%
jan 1, 2006
606.671 mln
+169.942 mln
38.91%
jan 1, 2007
700.937 mln
+94.266 mln
15.54%
jan 1, 2008
850.373 mln
+149.435 mln
21.32%
jan 1, 2009
968.36 mln
+117.987 mln
13.87%
jan 1, 2010
829.898 mln
-138.462 mln
-14.3%
jan 1, 2011
928.076 mln
+98.178 mln
11.83%
jan 1, 2012
1.197 bln
+269.37 mln
29.02%
jan 1, 2013
997.78 mln
-199.666 mln
-16.67%
jan 1, 2014
1.072 bln
+74.699 mln
7.49%
jan 1, 2015
1.209 bln
+136.08 mln
12.69%
jan 1, 2016
1.084 bln
-124.934 mln
-10.34%
Ranking of countries by current statistics by years


Comments: