29
/
en
AIzaSyAYiBZKx7MnpbEhh9jyipgxe19OcubqV5w
April 1, 2024
226906
Puerto Rico
PRI
true
2
1
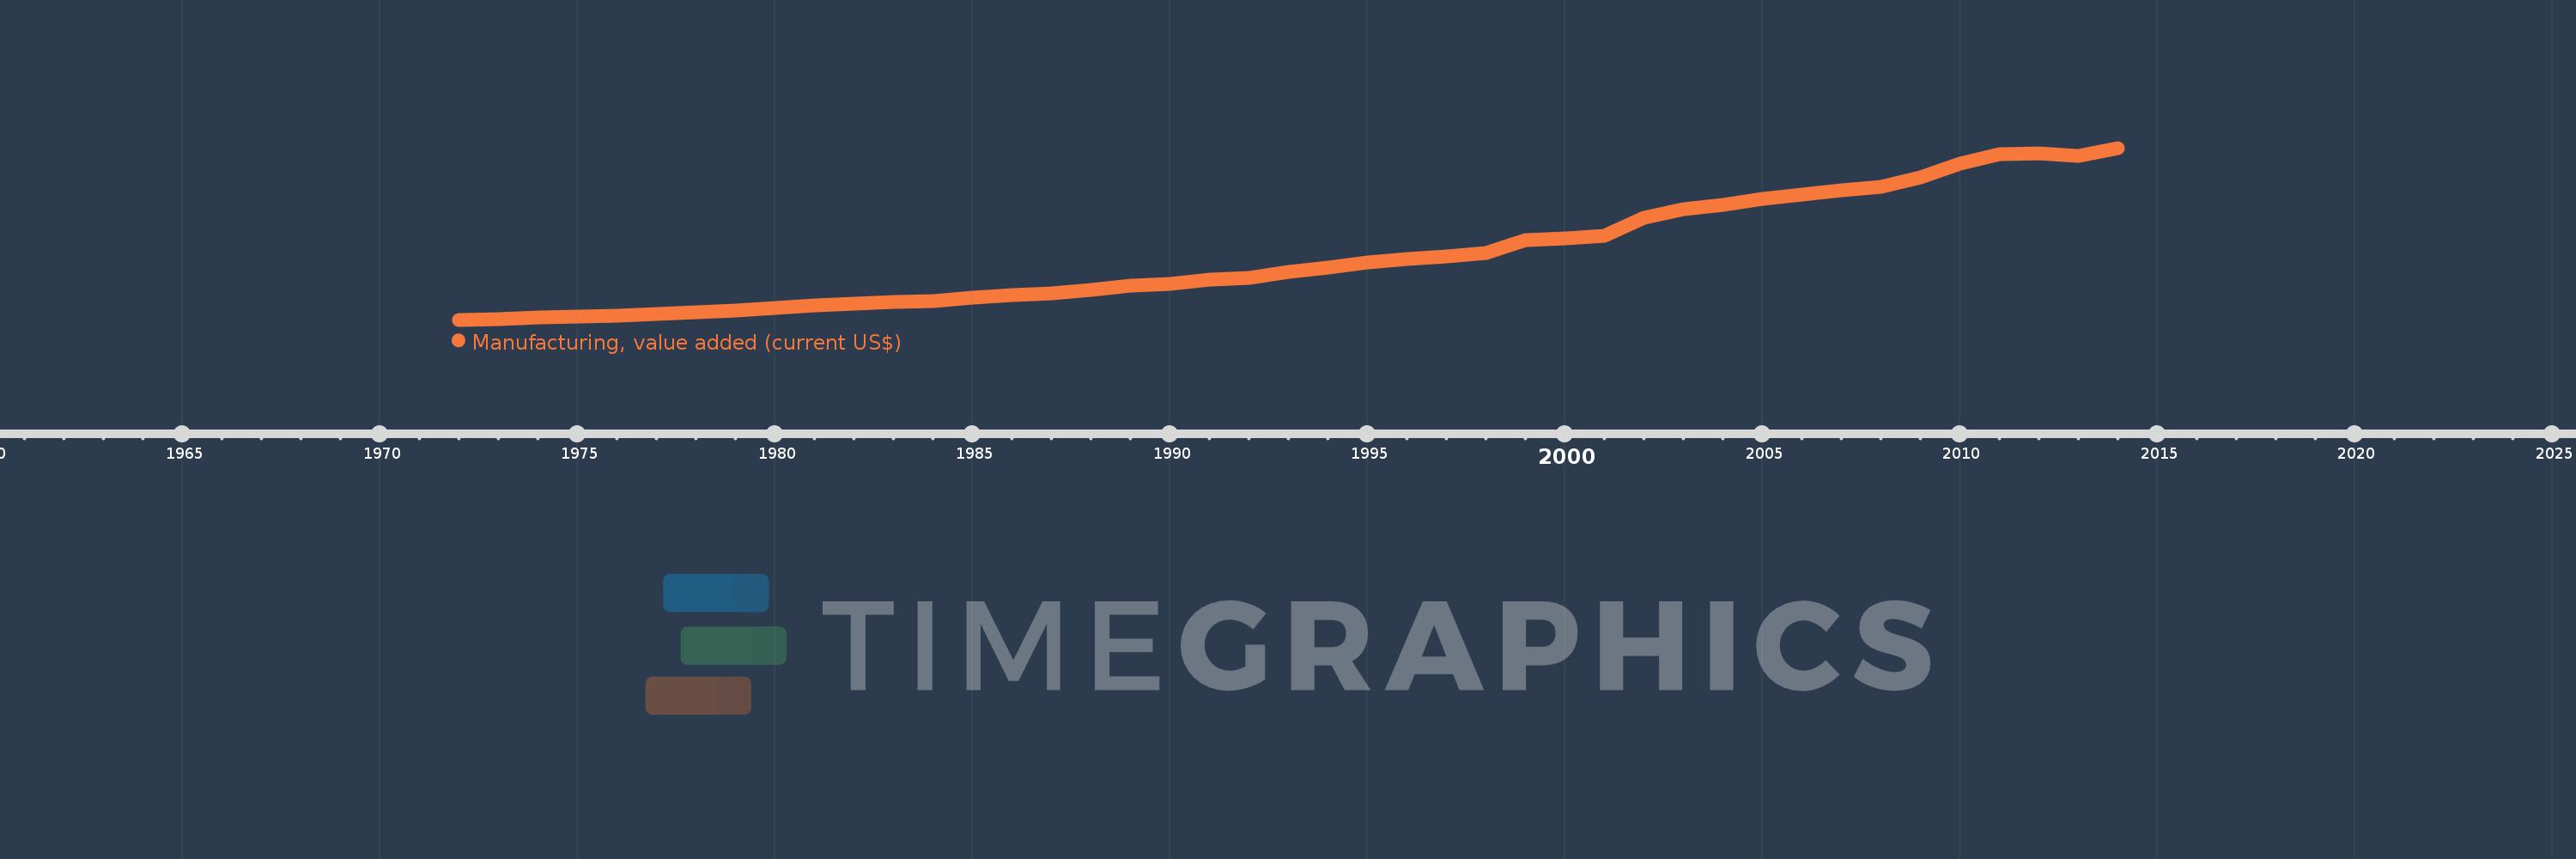
Manufacturing, value added (current US$)
2014,2013,2012,2011,2010,2009,2008,2007,2006,2005,2004,2003,2002,2001,2000,1999,1998,1997,1996,1995,1994,1993,1992,1991,1990,1989,1988,1987,1986,1985,1984,1983,1982,1981,1980,1979,1978,1977,1976,1975,1974,1973,1972
This statistics in other country:
AfghanistanAlbaniaAlgeriaAndorraAngolaAntigua and BarbudaArab WorldArgentinaArmeniaArubaAustraliaAustriaAzerbaijanBahamas, TheBahrainBangladeshBarbadosBelarusBelgiumBelizeBeninBermudaBhutanBoliviaBosnia and HerzegovinaBotswanaBrazilBrunei DarussalamBurkina FasoBurundiCabo VerdeCambodiaCameroonCanadaCaribbean small statesCayman IslandsCentral African RepublicCentral Europe and the BalticsChadChileChinaColombiaComorosCongo, Dem. Rep.Congo, Rep.Costa RicaCote d'IvoireCroatiaCubaCyprusCzech RepublicDenmarkDjiboutiDominicaDominican RepublicEarly-demographic dividendEast Asia & PacificEast Asia & Pacific (excluding high income)East Asia & Pacific (IDA & IBRD countries)EcuadorEgypt, Arab Rep.El SalvadorEquatorial GuineaEritreaEstoniaEthiopiaEuro areaEurope & Central AsiaEurope & Central Asia (excluding high income)Europe & Central Asia (IDA & IBRD countries)European UnionFaroe IslandsFijiFinlandFragile and conflict affected situationsFranceGabonGambia, TheGeorgiaGermanyGhanaGreeceGrenadaGuatemalaGuineaGuinea-BissauGuyanaHeavily indebted poor countries (HIPC)High incomeHondurasHong Kong SAR, ChinaHungaryIBRD onlyIcelandIDA & IBRD totalIDA blendIDA onlyIDA totalIndiaIndonesiaIran, Islamic Rep.IraqIrelandItalyJamaicaJapanJordanKazakhstanKenyaKiribatiKorea, Rep.KosovoKuwaitKyrgyz RepublicLao PDRLate-demographic dividendLatin America & Caribbean Latin America & Caribbean (excluding high income)Latin America & the Caribbean (IDA & IBRD countries)LatviaLeast developed countries: UN classificationLebanonLesothoLiberiaLibyaLithuaniaLow & middle incomeLow incomeLower middle incomeLuxembourgMacao SAR, ChinaMacedonia, FYRMadagascarMalawiMalaysiaMaldivesMaliMaltaMarshall IslandsMauritaniaMauritiusMexicoMicronesia, Fed. Sts.Middle East & North AfricaMiddle East & North Africa (excluding high income)Middle East & North Africa (IDA & IBRD countries)Middle incomeMoldovaMongoliaMontenegroMoroccoMozambiqueMyanmarNamibiaNepalNetherlandsNew CaledoniaNew ZealandNicaraguaNigerNigeriaNorth AmericaNorwayOECD membersOmanOther small statesPacific island small statesPakistanPalauPanamaPapua New GuineaParaguayPeruPhilippinesPolandPortugalPost-demographic dividendPre-demographic dividendPuerto RicoQatarRomaniaRussian FederationRwandaSamoaSao Tome and PrincipeSaudi ArabiaSenegalSerbiaSeychellesSierra LeoneSingaporeSlovak RepublicSloveniaSmall statesSolomon IslandsSouth AfricaSouth AsiaSouth Asia (IDA & IBRD)SpainSri LankaSt. Kitts and NevisSt. LuciaSt. Vincent and the GrenadinesSub-Saharan Africa Sub-Saharan Africa (excluding high income)Sub-Saharan Africa (IDA & IBRD countries)SudanSurinameSwazilandSwedenSwitzerlandSyrian Arab RepublicTajikistanTanzaniaThailandTimor-LesteTogoTongaTrinidad and TobagoTunisiaTurkeyTurkmenistanTuvaluUgandaUkraineUnited Arab EmiratesUnited KingdomUnited StatesUpper middle incomeUruguayUzbekistanVanuatuVenezuela, RBVietnamWest Bank and GazaWorldYemen, Rep.ZambiaZimbabwe Timeline:
This timeline shows a graph from 1972 to 2014 of Puerto Rico. No data until 1971. Number of actual observations by date: 43.
Source name:
World Development Indicators
Source organization:
World Bank national accounts data, and OECD National Accounts data files.
Categories, topics:
Economy & Growth
Last updated:
apr 23, 2017
Indicators value changes by year
Minimum:
1.345 bln
jan 1, 1972
Maximum:
48.213 bln
jan 1, 2014
At the date of observation
Value
Absolute change
Change from previous value
jan 1, 1972
1.345 bln
+1.345 bln
0.0%
jan 1, 1973
1.611 bln
+266.134 mln
19.79%
jan 1, 1974
1.893 bln
+282.264 mln
17.52%
jan 1, 1975
2.219 bln
+325.611 mln
17.2%
jan 1, 1976
2.39 bln
+171.374 mln
7.72%
jan 1, 1977
2.998 bln
+607.875 mln
25.43%
jan 1, 1978
3.326 bln
+327.628 mln
10.93%
jan 1, 1979
3.936 bln
+609.891 mln
18.34%
jan 1, 1980
4.478 bln
+542.35 mln
13.78%
jan 1, 1981
5.349 bln
+870.985 mln
19.45%
jan 1, 1982
5.84 bln
+490.937 mln
9.18%
jan 1, 1983
6.174 bln
+333.676 mln
5.71%
jan 1, 1984
6.458 bln
+284.28 mln
4.6%
jan 1, 1985
7.431 bln
+972.802 mln
15.06%
jan 1, 1986
7.973 bln
+542.35 mln
7.3%
jan 1, 1987
8.618 bln
+645.174 mln
8.09%
jan 1, 1988
9.56 bln
+941.551 mln
10.93%
jan 1, 1989
10.598 bln
+1.038 bln
10.86%
jan 1, 1990
11.223 bln
+625.013 mln
5.9%
jan 1, 1991
12.224 bln
+1.001 bln
8.92%
jan 1, 1992
12.763 bln
+539.325 mln
4.41%
jan 1, 1993
14.298 bln
+1.534 bln
12.02%
jan 1, 1994
15.553 bln
+1.255 bln
8.78%
jan 1, 1995
16.883 bln
+1.331 bln
8.56%
jan 1, 1996
18.011 bln
+1.128 bln
6.68%
jan 1, 1997
18.615 bln
+603.843 mln
3.35%
jan 1, 1998
19.458 bln
+842.759 mln
4.53%
jan 1, 1999
23.18 bln
+3.722 bln
19.13%
jan 1, 2000
23.499 bln
+319.563 mln
1.38%
jan 1, 2001
24.274 bln
+774.209 mln
3.29%
jan 1, 2002
29.272 bln
+4.998 bln
20.59%
jan 1, 2003
31.496 bln
+2.224 bln
7.6%
jan 1, 2004
32.652 bln
+1.157 bln
3.67%
jan 1, 2005
34.322 bln
+1.67 bln
5.11%
jan 1, 2006
35.581 bln
+1.258 bln
3.67%
jan 1, 2007
36.709 bln
+1.129 bln
3.17%
jan 1, 2008
37.637 bln
+927.1 mln
2.53%
jan 1, 2009
40.234 bln
+2.597 bln
6.9%
jan 1, 2010
43.872 bln
+3.638 bln
9.04%
jan 1, 2011
46.577 bln
+2.705 bln
6.17%
jan 1, 2012
46.832 bln
+254.8 mln
0.55%
jan 1, 2013
46.114 bln
-718.2 mln
-1.53%
jan 1, 2014
48.213 bln
+2.099 bln
4.55%
Ranking of countries by current statistics by years


Comments: