29
/
en
AIzaSyAYiBZKx7MnpbEhh9jyipgxe19OcubqV5w
April 1, 2024
76392
Bahamas, The
BHS
true
2
1
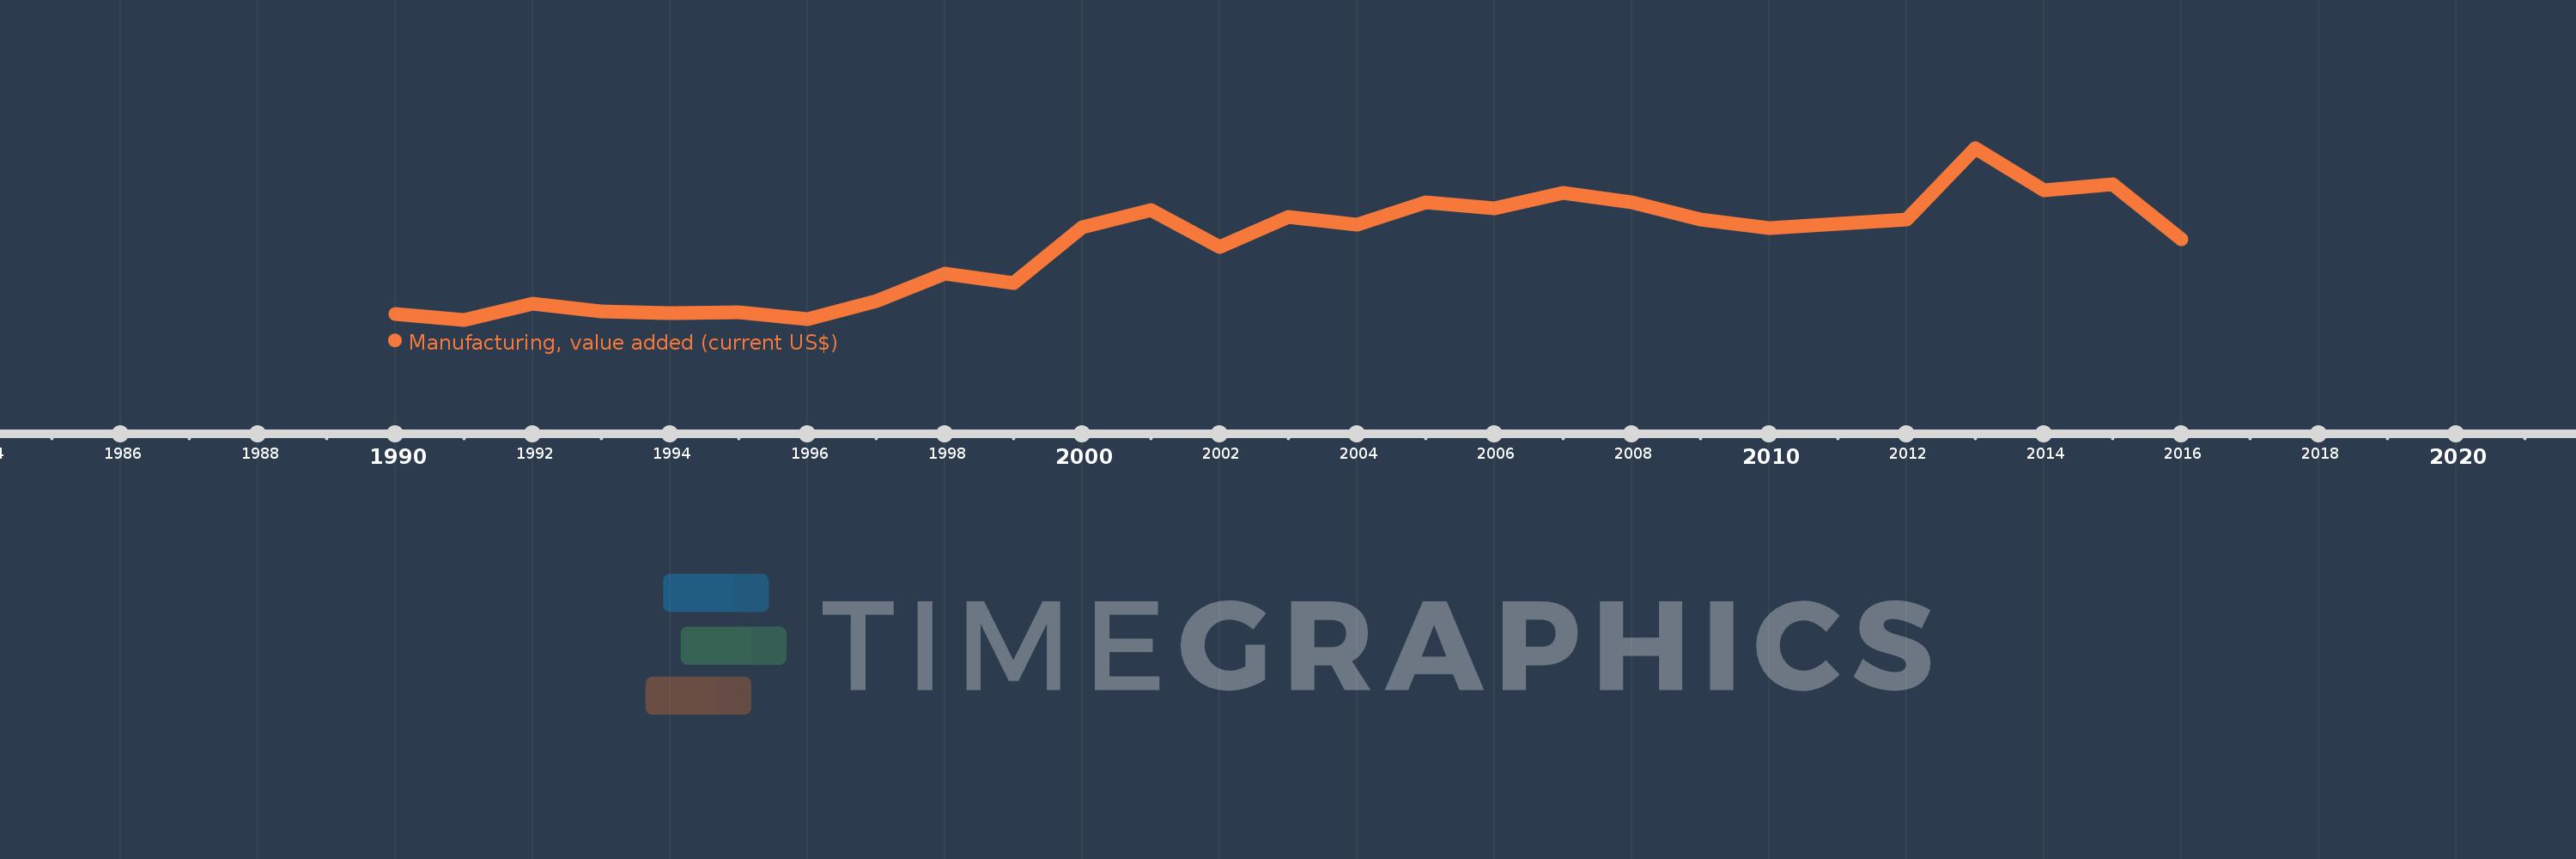
Manufacturing, value added (current US$)
2016,2015,2014,2013,2012,2011,2010,2009,2008,2007,2006,2005,2004,2003,2002,2001,2000,1999,1998,1997,1996,1995,1994,1993,1992,1991,1990
This statistics in other country:
AfghanistanAlbaniaAlgeriaAndorraAngolaAntigua and BarbudaArab WorldArgentinaArmeniaArubaAustraliaAustriaAzerbaijanBahamas, TheBahrainBangladeshBarbadosBelarusBelgiumBelizeBeninBermudaBhutanBoliviaBosnia and HerzegovinaBotswanaBrazilBrunei DarussalamBurkina FasoBurundiCabo VerdeCambodiaCameroonCanadaCaribbean small statesCayman IslandsCentral African RepublicCentral Europe and the BalticsChadChileChinaColombiaComorosCongo, Dem. Rep.Congo, Rep.Costa RicaCote d'IvoireCroatiaCubaCyprusCzech RepublicDenmarkDjiboutiDominicaDominican RepublicEarly-demographic dividendEast Asia & PacificEast Asia & Pacific (excluding high income)East Asia & Pacific (IDA & IBRD countries)EcuadorEgypt, Arab Rep.El SalvadorEquatorial GuineaEritreaEstoniaEthiopiaEuro areaEurope & Central AsiaEurope & Central Asia (excluding high income)Europe & Central Asia (IDA & IBRD countries)European UnionFaroe IslandsFijiFinlandFragile and conflict affected situationsFranceGabonGambia, TheGeorgiaGermanyGhanaGreeceGrenadaGuatemalaGuineaGuinea-BissauGuyanaHeavily indebted poor countries (HIPC)High incomeHondurasHong Kong SAR, ChinaHungaryIBRD onlyIcelandIDA & IBRD totalIDA blendIDA onlyIDA totalIndiaIndonesiaIran, Islamic Rep.IraqIrelandItalyJamaicaJapanJordanKazakhstanKenyaKiribatiKorea, Rep.KosovoKuwaitKyrgyz RepublicLao PDRLate-demographic dividendLatin America & Caribbean Latin America & Caribbean (excluding high income)Latin America & the Caribbean (IDA & IBRD countries)LatviaLeast developed countries: UN classificationLebanonLesothoLiberiaLibyaLithuaniaLow & middle incomeLow incomeLower middle incomeLuxembourgMacao SAR, ChinaMacedonia, FYRMadagascarMalawiMalaysiaMaldivesMaliMaltaMarshall IslandsMauritaniaMauritiusMexicoMicronesia, Fed. Sts.Middle East & North AfricaMiddle East & North Africa (excluding high income)Middle East & North Africa (IDA & IBRD countries)Middle incomeMoldovaMongoliaMontenegroMoroccoMozambiqueMyanmarNamibiaNepalNetherlandsNew CaledoniaNew ZealandNicaraguaNigerNigeriaNorth AmericaNorwayOECD membersOmanOther small statesPacific island small statesPakistanPalauPanamaPapua New GuineaParaguayPeruPhilippinesPolandPortugalPost-demographic dividendPre-demographic dividendPuerto RicoQatarRomaniaRussian FederationRwandaSamoaSao Tome and PrincipeSaudi ArabiaSenegalSerbiaSeychellesSierra LeoneSingaporeSlovak RepublicSloveniaSmall statesSolomon IslandsSouth AfricaSouth AsiaSouth Asia (IDA & IBRD)SpainSri LankaSt. Kitts and NevisSt. LuciaSt. Vincent and the GrenadinesSub-Saharan Africa Sub-Saharan Africa (excluding high income)Sub-Saharan Africa (IDA & IBRD countries)SudanSurinameSwazilandSwedenSwitzerlandSyrian Arab RepublicTajikistanTanzaniaThailandTimor-LesteTogoTongaTrinidad and TobagoTunisiaTurkeyTurkmenistanTuvaluUgandaUkraineUnited Arab EmiratesUnited KingdomUnited StatesUpper middle incomeUruguayUzbekistanVanuatuVenezuela, RBVietnamWest Bank and GazaWorldYemen, Rep.ZambiaZimbabwe Timeline:
This timeline shows a graph from 1990 to 2016 of Bahamas, The. No data until 1989. Number of actual observations by date: 27.
Source name:
World Development Indicators
Source organization:
World Bank national accounts data, and OECD National Accounts data files.
Categories, topics:
Economy & Growth
Last updated:
apr 23, 2017
Indicators value changes by year
Minimum:
120.438 mln
jan 1, 1991
Maximum:
435.714 mln
jan 1, 2013
At the date of observation
Value
Absolute change
Change from previous value
jan 1, 1990
131.439 mln
+131.439 mln
0.0%
jan 1, 1991
120.438 mln
-11.001 mln
-8.37%
jan 1, 1992
149.36 mln
+28.922 mln
24.01%
jan 1, 1993
135.535 mln
-13.825 mln
-9.26%
jan 1, 1994
131.806 mln
-3.729 mln
-2.75%
jan 1, 1995
133.966 mln
+2.16 mln
1.64%
jan 1, 1996
121.136 mln
-12.83 mln
-9.58%
jan 1, 1997
154.169 mln
+33.033 mln
27.27%
jan 1, 1998
205.024 mln
+50.855 mln
32.99%
jan 1, 1999
188.232 mln
-16.792 mln
-8.19%
jan 1, 2000
289.846 mln
+101.614 mln
53.98%
jan 1, 2001
321.737 mln
+31.891 mln
11.0%
jan 1, 2002
253.907 mln
-67.83 mln
-21.08%
jan 1, 2003
309.47 mln
+55.563 mln
21.88%
jan 1, 2004
295.333 mln
-14.137 mln
-4.57%
jan 1, 2005
335.693 mln
+40.36 mln
13.67%
jan 1, 2006
324.565 mln
-11.128 mln
-3.31%
jan 1, 2007
353.808 mln
+29.243 mln
9.01%
jan 1, 2008
336.248 mln
-17.56 mln
-4.96%
jan 1, 2009
304.76 mln
-31.488 mln
-9.36%
jan 1, 2010
288.282 mln
-16.478 mln
-5.41%
jan 1, 2011
296.365 mln
+8.083 mln
2.8%
jan 1, 2012
304.549 mln
+8.184 mln
2.76%
jan 1, 2013
435.714 mln
+131.165 mln
43.07%
jan 1, 2014
357.564 mln
-78.15 mln
-17.94%
jan 1, 2015
368.296 mln
+10.732 mln
3.0%
jan 1, 2016
268.571 mln
-99.725 mln
-27.08%
Ranking of countries by current statistics by years


Comments: