29
/
en
AIzaSyAYiBZKx7MnpbEhh9jyipgxe19OcubqV5w
April 1, 2024
30048
Euro area
EMU
false
2
1
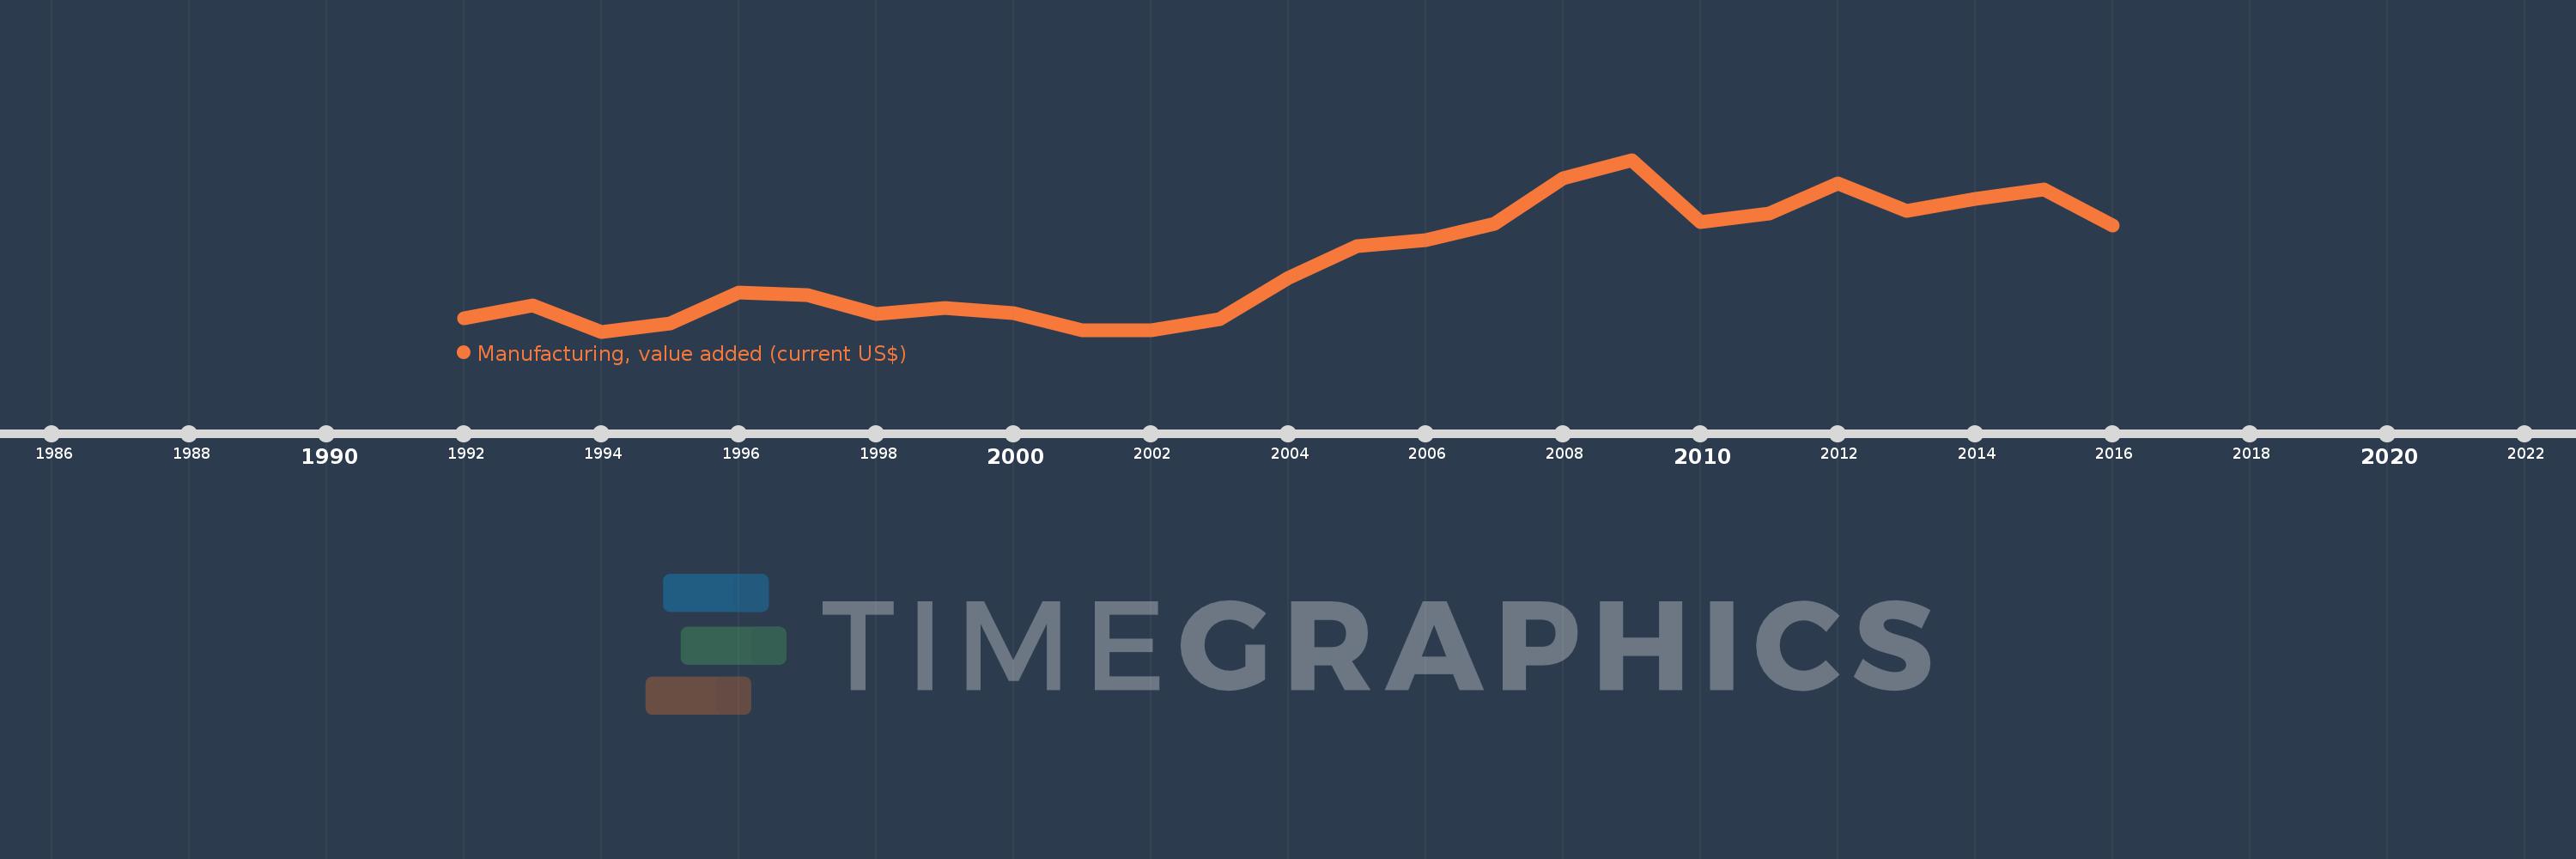
Manufacturing, value added (current US$)
2016,2015,2014,2013,2012,2011,2010,2009,2008,2007,2006,2005,2004,2003,2002,2001,2000,1999,1998,1997,1996,1995,1994,1993,1992
This statistics in other country:
AfghanistanAlbaniaAlgeriaAndorraAngolaAntigua and BarbudaArab WorldArgentinaArmeniaArubaAustraliaAustriaAzerbaijanBahamas, TheBahrainBangladeshBarbadosBelarusBelgiumBelizeBeninBermudaBhutanBoliviaBosnia and HerzegovinaBotswanaBrazilBrunei DarussalamBurkina FasoBurundiCabo VerdeCambodiaCameroonCanadaCaribbean small statesCayman IslandsCentral African RepublicCentral Europe and the BalticsChadChileChinaColombiaComorosCongo, Dem. Rep.Congo, Rep.Costa RicaCote d'IvoireCroatiaCubaCyprusCzech RepublicDenmarkDjiboutiDominicaDominican RepublicEarly-demographic dividendEast Asia & PacificEast Asia & Pacific (excluding high income)East Asia & Pacific (IDA & IBRD countries)EcuadorEgypt, Arab Rep.El SalvadorEquatorial GuineaEritreaEstoniaEthiopiaEuro areaEurope & Central AsiaEurope & Central Asia (excluding high income)Europe & Central Asia (IDA & IBRD countries)European UnionFaroe IslandsFijiFinlandFragile and conflict affected situationsFranceGabonGambia, TheGeorgiaGermanyGhanaGreeceGrenadaGuatemalaGuineaGuinea-BissauGuyanaHeavily indebted poor countries (HIPC)High incomeHondurasHong Kong SAR, ChinaHungaryIBRD onlyIcelandIDA & IBRD totalIDA blendIDA onlyIDA totalIndiaIndonesiaIran, Islamic Rep.IraqIrelandItalyJamaicaJapanJordanKazakhstanKenyaKiribatiKorea, Rep.KosovoKuwaitKyrgyz RepublicLao PDRLate-demographic dividendLatin America & Caribbean Latin America & Caribbean (excluding high income)Latin America & the Caribbean (IDA & IBRD countries)LatviaLeast developed countries: UN classificationLebanonLesothoLiberiaLibyaLithuaniaLow & middle incomeLow incomeLower middle incomeLuxembourgMacao SAR, ChinaMacedonia, FYRMadagascarMalawiMalaysiaMaldivesMaliMaltaMarshall IslandsMauritaniaMauritiusMexicoMicronesia, Fed. Sts.Middle East & North AfricaMiddle East & North Africa (excluding high income)Middle East & North Africa (IDA & IBRD countries)Middle incomeMoldovaMongoliaMontenegroMoroccoMozambiqueMyanmarNamibiaNepalNetherlandsNew CaledoniaNew ZealandNicaraguaNigerNigeriaNorth AmericaNorwayOECD membersOmanOther small statesPacific island small statesPakistanPalauPanamaPapua New GuineaParaguayPeruPhilippinesPolandPortugalPost-demographic dividendPre-demographic dividendPuerto RicoQatarRomaniaRussian FederationRwandaSamoaSao Tome and PrincipeSaudi ArabiaSenegalSerbiaSeychellesSierra LeoneSingaporeSlovak RepublicSloveniaSmall statesSolomon IslandsSouth AfricaSouth AsiaSouth Asia (IDA & IBRD)SpainSri LankaSt. Kitts and NevisSt. LuciaSt. Vincent and the GrenadinesSub-Saharan Africa Sub-Saharan Africa (excluding high income)Sub-Saharan Africa (IDA & IBRD countries)SudanSurinameSwazilandSwedenSwitzerlandSyrian Arab RepublicTajikistanTanzaniaThailandTimor-LesteTogoTongaTrinidad and TobagoTunisiaTurkeyTurkmenistanTuvaluUgandaUkraineUnited Arab EmiratesUnited KingdomUnited StatesUpper middle incomeUruguayUzbekistanVanuatuVenezuela, RBVietnamWest Bank and GazaWorldYemen, Rep.ZambiaZimbabwe Timeline:
This timeline shows a graph from 1992 to 2016 of Euro area. No data until 1991. Number of actual observations by date: 25.
Source name:
World Development Indicators
Source organization:
World Bank national accounts data, and OECD National Accounts data files.
Categories, topics:
Economy & Growth
Last updated:
apr 23, 2017
Indicators value changes by year
Minimum:
1.12 trl
jan 1, 1994
Maximum:
2.142 trl
jan 1, 2009
At the date of observation
Value
Absolute change
Change from previous value
jan 1, 1992
1.201 trl
+1.201 trl
0.0%
jan 1, 1993
1.278 trl
+76.439 bln
6.36%
jan 1, 1994
1.12 trl
-157.217 bln
-12.31%
jan 1, 1995
1.171 trl
+50.363 bln
4.5%
jan 1, 1996
1.351 trl
+180.622 bln
15.43%
jan 1, 1997
1.336 trl
-15.378 bln
-1.14%
jan 1, 1998
1.225 trl
-111.24 bln
-8.33%
jan 1, 1999
1.261 trl
+35.911 bln
2.93%
jan 1, 2000
1.23 trl
-30.249 bln
-2.4%
jan 1, 2001
1.13 trl
-100.781 bln
-8.19%
jan 1, 2002
1.13 trl
-55.382 mln
0.0%
jan 1, 2003
1.196 trl
+66.682 bln
5.9%
jan 1, 2004
1.438 trl
+242.073 bln
20.24%
jan 1, 2005
1.63 trl
+191.247 bln
13.3%
jan 1, 2006
1.663 trl
+33.059 bln
2.03%
jan 1, 2007
1.761 trl
+98.191 bln
5.91%
jan 1, 2008
2.032 trl
+271.27 bln
15.41%
jan 1, 2009
2.142 trl
+110.138 bln
5.42%
jan 1, 2010
1.773 trl
-368.93 bln
-17.22%
jan 1, 2011
1.822 trl
+48.382 bln
2.73%
jan 1, 2012
2.004 trl
+182.473 bln
10.02%
jan 1, 2013
1.837 trl
-166.646 bln
-8.32%
jan 1, 2014
1.909 trl
+71.755 bln
3.91%
jan 1, 2015
1.966 trl
+56.98 bln
2.98%
jan 1, 2016
1.751 trl
-214.937 bln
-10.93%
Ranking of countries by current statistics by years


Comments: