29
/
en
AIzaSyAYiBZKx7MnpbEhh9jyipgxe19OcubqV5w
April 1, 2024
262523
Thailand
THA
true
2
1
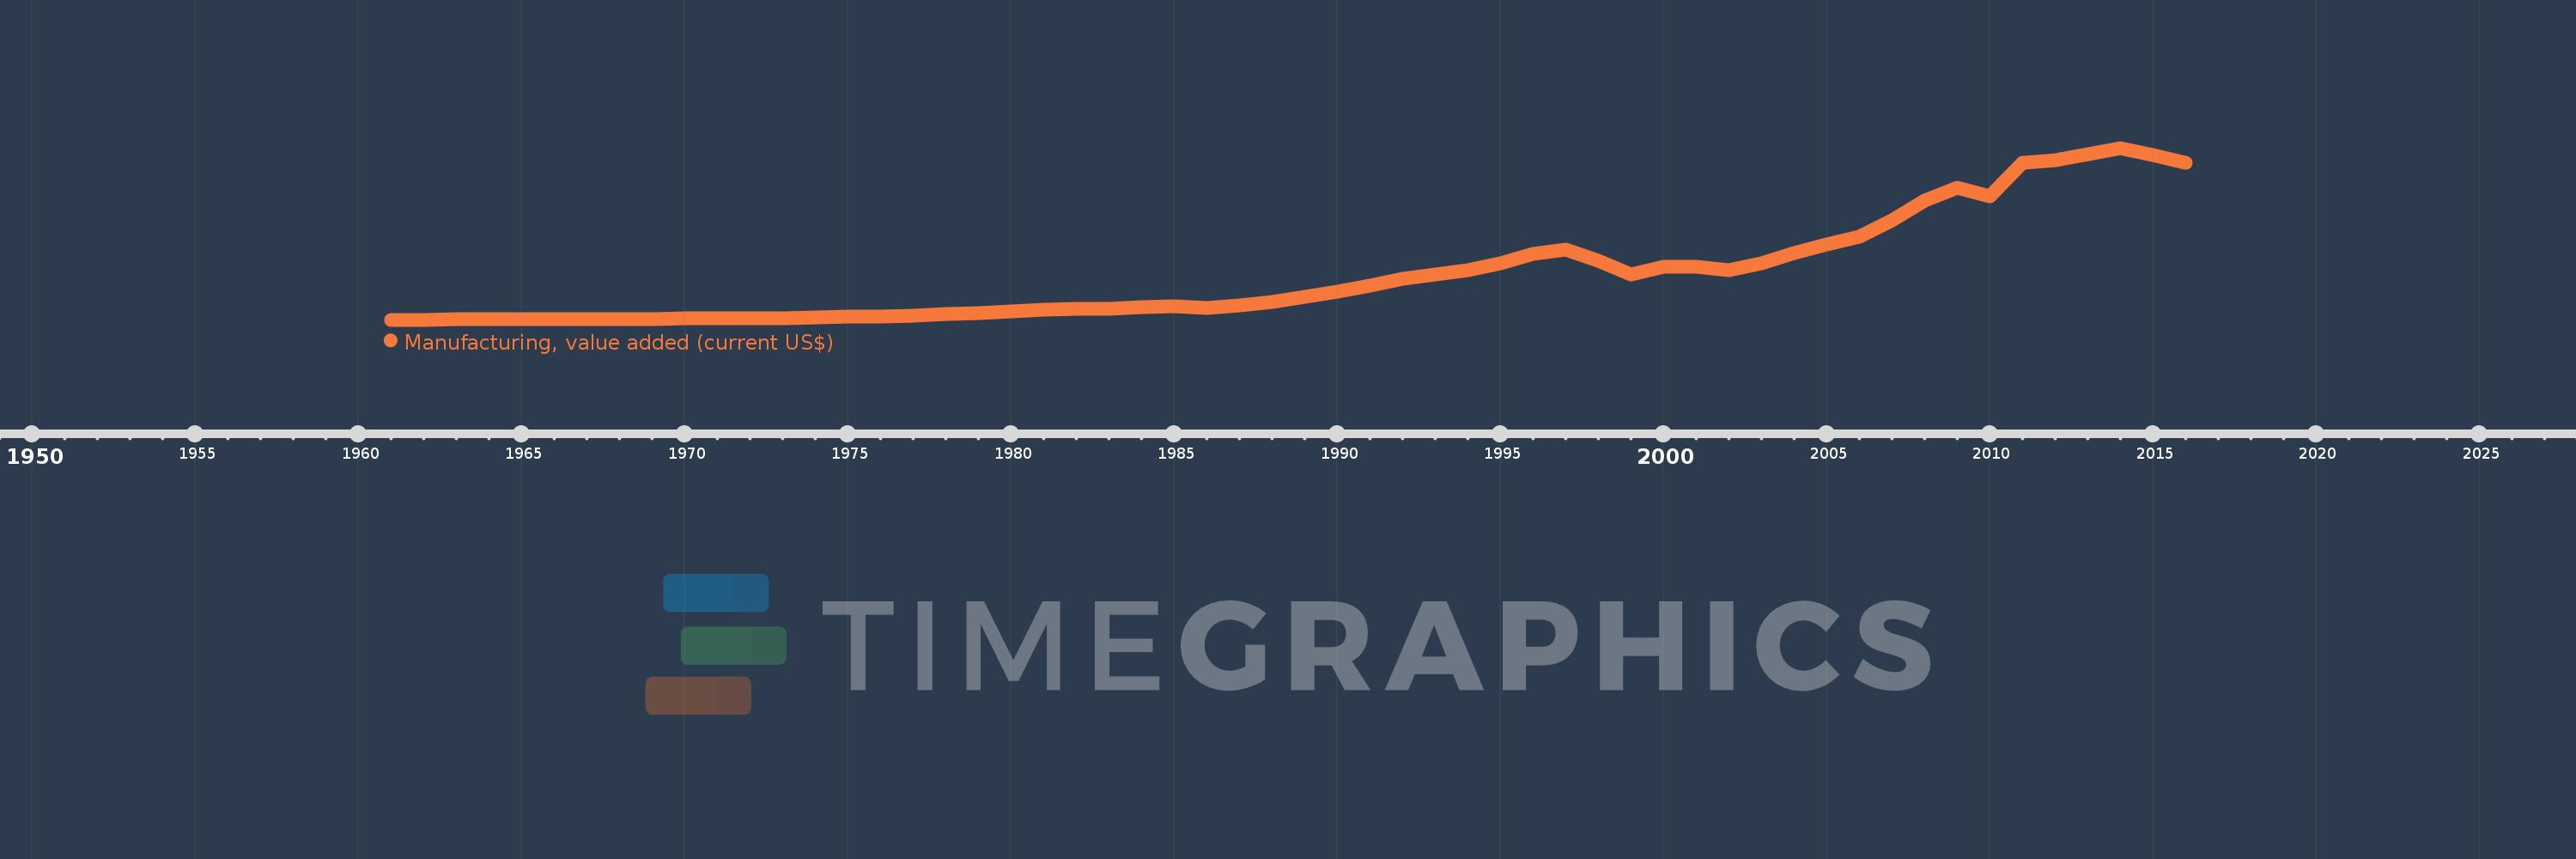
Manufacturing, value added (current US$)
2016,2015,2014,2013,2012,2011,2010,2009,2008,2007,2006,2005,2004,2003,2002,2001,2000,1999,1998,1997,1996,1995,1994,1993,1992,1991,1990,1989,1988,1987,1986,1985,1984,1983,1982,1981,1980,1979,1978,1977,1976,1975,1974,1973,1972,1971,1970,1969,1968,1967,1966,1965,1964,1963,1962,1961
This statistics in other country:
AfghanistanAlbaniaAlgeriaAndorraAngolaAntigua and BarbudaArab WorldArgentinaArmeniaArubaAustraliaAustriaAzerbaijanBahamas, TheBahrainBangladeshBarbadosBelarusBelgiumBelizeBeninBermudaBhutanBoliviaBosnia and HerzegovinaBotswanaBrazilBrunei DarussalamBurkina FasoBurundiCabo VerdeCambodiaCameroonCanadaCaribbean small statesCayman IslandsCentral African RepublicCentral Europe and the BalticsChadChileChinaColombiaComorosCongo, Dem. Rep.Congo, Rep.Costa RicaCote d'IvoireCroatiaCubaCyprusCzech RepublicDenmarkDjiboutiDominicaDominican RepublicEarly-demographic dividendEast Asia & PacificEast Asia & Pacific (excluding high income)East Asia & Pacific (IDA & IBRD countries)EcuadorEgypt, Arab Rep.El SalvadorEquatorial GuineaEritreaEstoniaEthiopiaEuro areaEurope & Central AsiaEurope & Central Asia (excluding high income)Europe & Central Asia (IDA & IBRD countries)European UnionFaroe IslandsFijiFinlandFragile and conflict affected situationsFranceGabonGambia, TheGeorgiaGermanyGhanaGreeceGrenadaGuatemalaGuineaGuinea-BissauGuyanaHeavily indebted poor countries (HIPC)High incomeHondurasHong Kong SAR, ChinaHungaryIBRD onlyIcelandIDA & IBRD totalIDA blendIDA onlyIDA totalIndiaIndonesiaIran, Islamic Rep.IraqIrelandItalyJamaicaJapanJordanKazakhstanKenyaKiribatiKorea, Rep.KosovoKuwaitKyrgyz RepublicLao PDRLate-demographic dividendLatin America & Caribbean Latin America & Caribbean (excluding high income)Latin America & the Caribbean (IDA & IBRD countries)LatviaLeast developed countries: UN classificationLebanonLesothoLiberiaLibyaLithuaniaLow & middle incomeLow incomeLower middle incomeLuxembourgMacao SAR, ChinaMacedonia, FYRMadagascarMalawiMalaysiaMaldivesMaliMaltaMarshall IslandsMauritaniaMauritiusMexicoMicronesia, Fed. Sts.Middle East & North AfricaMiddle East & North Africa (excluding high income)Middle East & North Africa (IDA & IBRD countries)Middle incomeMoldovaMongoliaMontenegroMoroccoMozambiqueMyanmarNamibiaNepalNetherlandsNew CaledoniaNew ZealandNicaraguaNigerNigeriaNorth AmericaNorwayOECD membersOmanOther small statesPacific island small statesPakistanPalauPanamaPapua New GuineaParaguayPeruPhilippinesPolandPortugalPost-demographic dividendPre-demographic dividendPuerto RicoQatarRomaniaRussian FederationRwandaSamoaSao Tome and PrincipeSaudi ArabiaSenegalSerbiaSeychellesSierra LeoneSingaporeSlovak RepublicSloveniaSmall statesSolomon IslandsSouth AfricaSouth AsiaSouth Asia (IDA & IBRD)SpainSri LankaSt. Kitts and NevisSt. LuciaSt. Vincent and the GrenadinesSub-Saharan Africa Sub-Saharan Africa (excluding high income)Sub-Saharan Africa (IDA & IBRD countries)SudanSurinameSwazilandSwedenSwitzerlandSyrian Arab RepublicTajikistanTanzaniaThailandTimor-LesteTogoTongaTrinidad and TobagoTunisiaTurkeyTurkmenistanTuvaluUgandaUkraineUnited Arab EmiratesUnited KingdomUnited StatesUpper middle incomeUruguayUzbekistanVanuatuVenezuela, RBVietnamWest Bank and GazaWorldYemen, Rep.ZambiaZimbabwe Timeline:
This timeline shows a graph from 1961 to 2016 of Thailand. No data until 1960. Number of actual observations by date: 56.
Source name:
World Development Indicators
Source organization:
World Bank national accounts data, and OECD National Accounts data files.
Categories, topics:
Economy & Growth
Last updated:
apr 23, 2017
Indicators value changes by year
Minimum:
346.108 mln
jan 1, 1961
Maximum:
116.249 bln
jan 1, 2014
At the date of observation
Value
Absolute change
Change from previous value
jan 1, 1961
346.108 mln
+346.108 mln
0.0%
jan 1, 1962
394.213 mln
+48.105 mln
13.9%
jan 1, 1963
464.708 mln
+70.495 mln
17.88%
jan 1, 1964
502.055 mln
+37.347 mln
8.04%
jan 1, 1965
539.058 mln
+37.003 mln
7.37%
jan 1, 1966
621.99 mln
+82.933 mln
15.38%
jan 1, 1967
720.476 mln
+98.486 mln
15.83%
jan 1, 1968
860.423 mln
+139.947 mln
19.42%
jan 1, 1969
927.803 mln
+67.38 mln
7.83%
jan 1, 1970
1.042 bln
+114.034 mln
12.29%
jan 1, 1971
1.13 bln
+87.971 mln
8.44%
jan 1, 1972
1.293 bln
+163.462 mln
14.47%
jan 1, 1973
1.505 bln
+211.538 mln
16.36%
jan 1, 1974
2.079 bln
+574.093 mln
38.15%
jan 1, 1975
2.626 bln
+546.853 mln
26.3%
jan 1, 1976
2.777 bln
+151.574 mln
5.77%
jan 1, 1977
3.343 bln
+565.793 mln
20.37%
jan 1, 1978
3.99 bln
+647.055 mln
19.35%
jan 1, 1979
4.804 bln
+814.088 mln
20.4%
jan 1, 1980
5.759 bln
+955.106 mln
19.88%
jan 1, 1981
6.959 bln
+1.2 bln
20.84%
jan 1, 1982
7.889 bln
+929.659 mln
13.36%
jan 1, 1983
7.802 bln
-87.468 mln
-1.11%
jan 1, 1984
8.862 bln
+1.061 bln
13.6%
jan 1, 1985
9.576 bln
+713.1 mln
8.05%
jan 1, 1986
8.528 bln
-1.048 bln
-10.94%
jan 1, 1987
10.29 bln
+1.762 bln
20.66%
jan 1, 1988
12.257 bln
+1.968 bln
19.12%
jan 1, 1989
15.934 bln
+3.677 bln
30.0%
jan 1, 1990
19.326 bln
+3.392 bln
21.29%
jan 1, 1991
23.216 bln
+3.891 bln
20.13%
jan 1, 1992
27.743 bln
+4.526 bln
19.5%
jan 1, 1993
30.669 bln
+2.926 bln
10.55%
jan 1, 1994
34.038 bln
+3.37 bln
10.99%
jan 1, 1995
38.343 bln
+4.304 bln
12.65%
jan 1, 1996
44.802 bln
+6.46 bln
16.85%
jan 1, 1997
47.451 bln
+2.649 bln
5.91%
jan 1, 1998
40.113 bln
-7.338 bln
-15.46%
jan 1, 1999
31.103 bln
-9.01 bln
-22.46%
jan 1, 2000
35.959 bln
+4.856 bln
15.61%
jan 1, 2001
36.139 bln
+180.07 mln
0.5%
jan 1, 2002
33.725 bln
-2.414 bln
-6.68%
jan 1, 2003
38.567 bln
+4.842 bln
14.36%
jan 1, 2004
45.339 bln
+6.772 bln
17.56%
jan 1, 2005
51.184 bln
+5.845 bln
12.89%
jan 1, 2006
56.405 bln
+5.221 bln
10.2%
jan 1, 2007
67.275 bln
+10.87 bln
19.27%
jan 1, 2008
80.849 bln
+13.575 bln
20.18%
jan 1, 2009
89.483 bln
+8.634 bln
10.68%
jan 1, 2010
83.422 bln
-6.061 bln
-6.77%
jan 1, 2011
105.987 bln
+22.565 bln
27.05%
jan 1, 2012
108.04 bln
+2.053 bln
1.94%
jan 1, 2013
111.759 bln
+3.719 bln
3.44%
jan 1, 2014
116.249 bln
+4.49 bln
4.02%
jan 1, 2015
111.473 bln
-4.776 bln
-4.11%
jan 1, 2016
106.368 bln
-5.105 bln
-4.58%
Ranking of countries by current statistics by years


Comments: