29
/
en
AIzaSyAYiBZKx7MnpbEhh9jyipgxe19OcubqV5w
April 1, 2024
214547
Norway
NOR
true
2
1
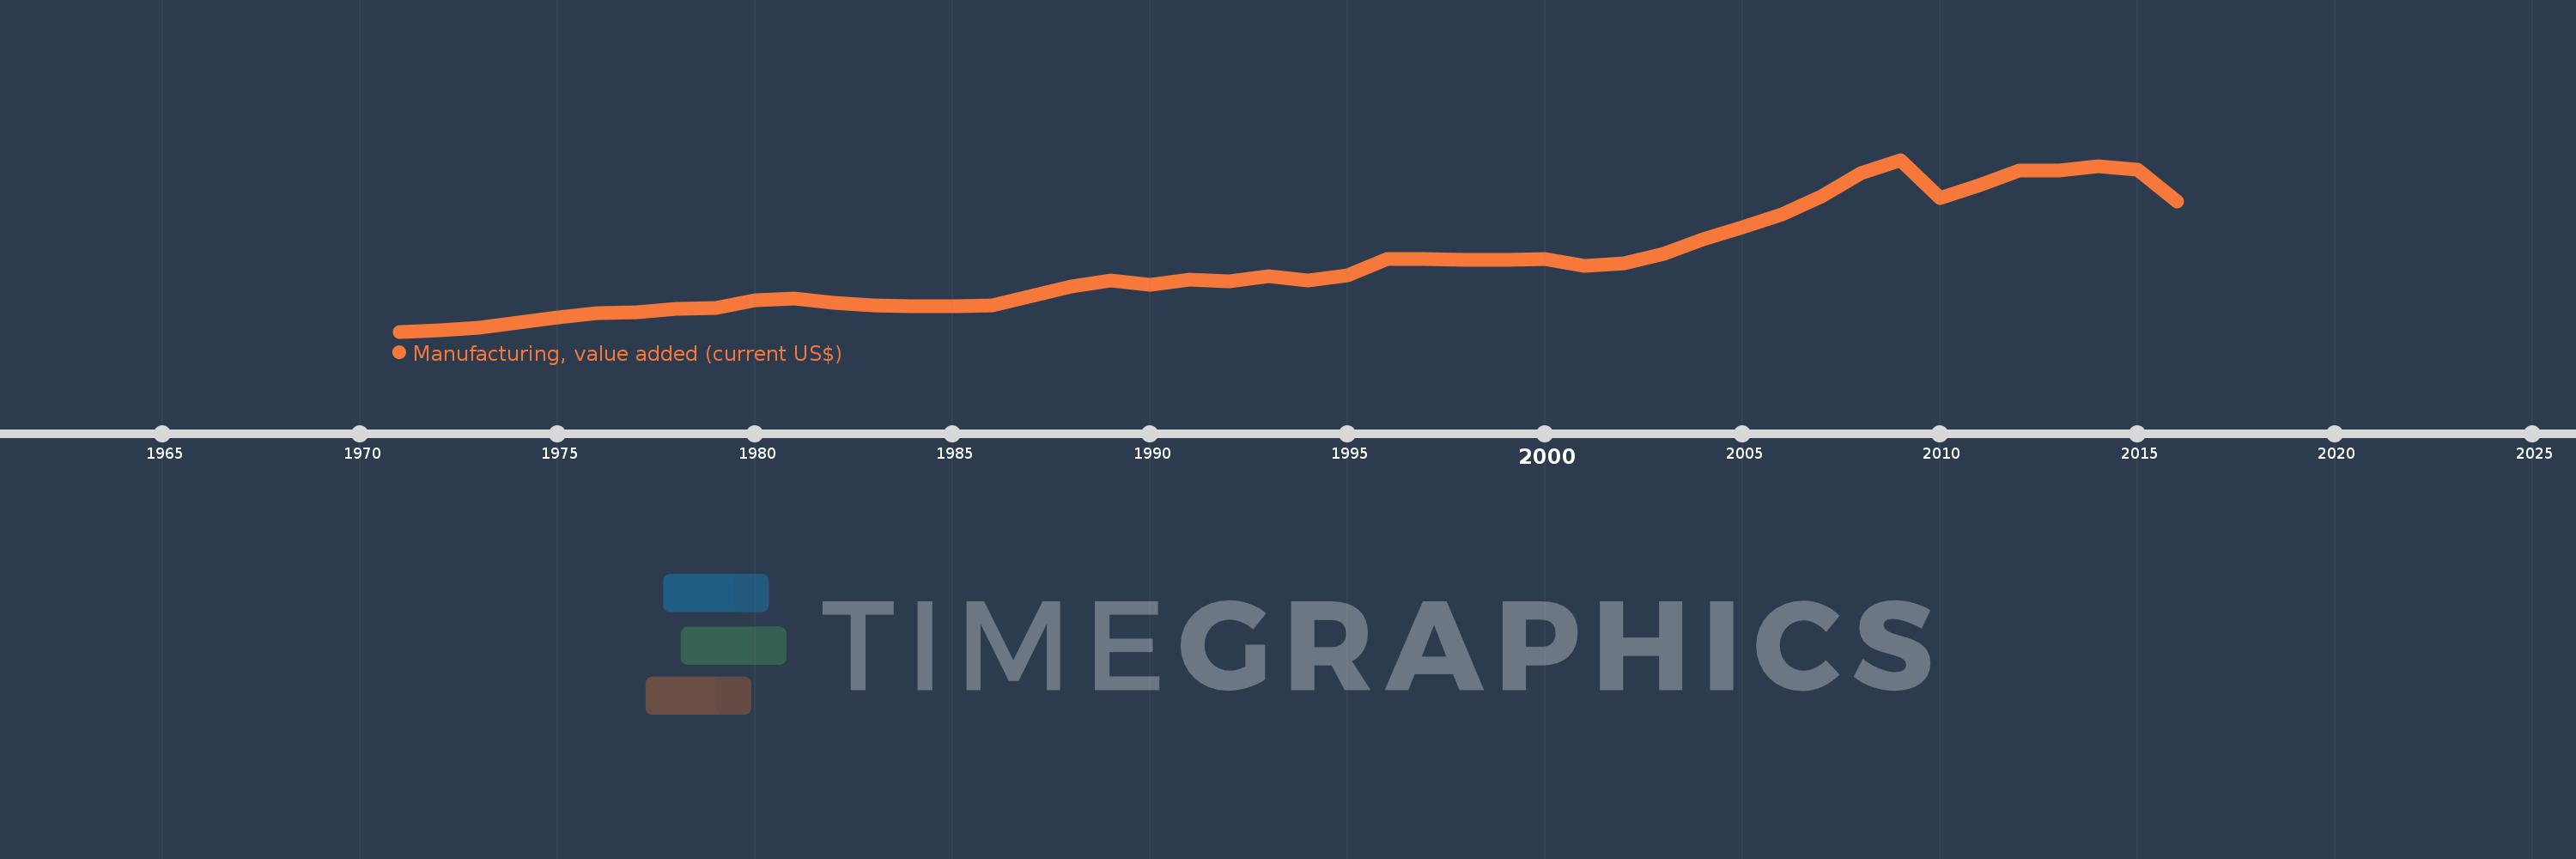
Manufacturing, value added (current US$)
2016,2015,2014,2013,2012,2011,2010,2009,2008,2007,2006,2005,2004,2003,2002,2001,2000,1999,1998,1997,1996,1995,1994,1993,1992,1991,1990,1989,1988,1987,1986,1985,1984,1983,1982,1981,1980,1979,1978,1977,1976,1975,1974,1973,1972,1971
This statistics in other country:
AfghanistanAlbaniaAlgeriaAndorraAngolaAntigua and BarbudaArab WorldArgentinaArmeniaArubaAustraliaAustriaAzerbaijanBahamas, TheBahrainBangladeshBarbadosBelarusBelgiumBelizeBeninBermudaBhutanBoliviaBosnia and HerzegovinaBotswanaBrazilBrunei DarussalamBurkina FasoBurundiCabo VerdeCambodiaCameroonCanadaCaribbean small statesCayman IslandsCentral African RepublicCentral Europe and the BalticsChadChileChinaColombiaComorosCongo, Dem. Rep.Congo, Rep.Costa RicaCote d'IvoireCroatiaCubaCyprusCzech RepublicDenmarkDjiboutiDominicaDominican RepublicEarly-demographic dividendEast Asia & PacificEast Asia & Pacific (excluding high income)East Asia & Pacific (IDA & IBRD countries)EcuadorEgypt, Arab Rep.El SalvadorEquatorial GuineaEritreaEstoniaEthiopiaEuro areaEurope & Central AsiaEurope & Central Asia (excluding high income)Europe & Central Asia (IDA & IBRD countries)European UnionFaroe IslandsFijiFinlandFragile and conflict affected situationsFranceGabonGambia, TheGeorgiaGermanyGhanaGreeceGrenadaGuatemalaGuineaGuinea-BissauGuyanaHeavily indebted poor countries (HIPC)High incomeHondurasHong Kong SAR, ChinaHungaryIBRD onlyIcelandIDA & IBRD totalIDA blendIDA onlyIDA totalIndiaIndonesiaIran, Islamic Rep.IraqIrelandItalyJamaicaJapanJordanKazakhstanKenyaKiribatiKorea, Rep.KosovoKuwaitKyrgyz RepublicLao PDRLate-demographic dividendLatin America & Caribbean Latin America & Caribbean (excluding high income)Latin America & the Caribbean (IDA & IBRD countries)LatviaLeast developed countries: UN classificationLebanonLesothoLiberiaLibyaLithuaniaLow & middle incomeLow incomeLower middle incomeLuxembourgMacao SAR, ChinaMacedonia, FYRMadagascarMalawiMalaysiaMaldivesMaliMaltaMarshall IslandsMauritaniaMauritiusMexicoMicronesia, Fed. Sts.Middle East & North AfricaMiddle East & North Africa (excluding high income)Middle East & North Africa (IDA & IBRD countries)Middle incomeMoldovaMongoliaMontenegroMoroccoMozambiqueMyanmarNamibiaNepalNetherlandsNew CaledoniaNew ZealandNicaraguaNigerNigeriaNorth AmericaNorwayOECD membersOmanOther small statesPacific island small statesPakistanPalauPanamaPapua New GuineaParaguayPeruPhilippinesPolandPortugalPost-demographic dividendPre-demographic dividendPuerto RicoQatarRomaniaRussian FederationRwandaSamoaSao Tome and PrincipeSaudi ArabiaSenegalSerbiaSeychellesSierra LeoneSingaporeSlovak RepublicSloveniaSmall statesSolomon IslandsSouth AfricaSouth AsiaSouth Asia (IDA & IBRD)SpainSri LankaSt. Kitts and NevisSt. LuciaSt. Vincent and the GrenadinesSub-Saharan Africa Sub-Saharan Africa (excluding high income)Sub-Saharan Africa (IDA & IBRD countries)SudanSurinameSwazilandSwedenSwitzerlandSyrian Arab RepublicTajikistanTanzaniaThailandTimor-LesteTogoTongaTrinidad and TobagoTunisiaTurkeyTurkmenistanTuvaluUgandaUkraineUnited Arab EmiratesUnited KingdomUnited StatesUpper middle incomeUruguayUzbekistanVanuatuVenezuela, RBVietnamWest Bank and GazaWorldYemen, Rep.ZambiaZimbabwe Timeline:
This timeline shows a graph from 1971 to 2016 of Norway. No data until 1970. Number of actual observations by date: 46.
Source name:
World Development Indicators
Source organization:
World Bank national accounts data, and OECD National Accounts data files.
Categories, topics:
Economy & Growth
Last updated:
apr 23, 2017
Indicators value changes by year
Minimum:
2.266 bln
jan 1, 1971
Maximum:
35.779 bln
jan 1, 2009
At the date of observation
Value
Absolute change
Change from previous value
jan 1, 1971
2.266 bln
+2.266 bln
0.0%
jan 1, 1972
2.503 bln
+237.55 mln
10.48%
jan 1, 1973
3.005 bln
+501.481 mln
20.03%
jan 1, 1974
3.989 bln
+984.294 mln
32.76%
jan 1, 1975
4.97 bln
+980.912 mln
24.59%
jan 1, 1976
5.855 bln
+884.588 mln
17.8%
jan 1, 1977
5.965 bln
+110.466 mln
1.89%
jan 1, 1978
6.649 bln
+683.454 mln
11.46%
jan 1, 1979
6.894 bln
+245.287 mln
3.69%
jan 1, 1980
8.337 bln
+1.443 bln
20.93%
jan 1, 1981
8.669 bln
+331.69 mln
3.98%
jan 1, 1982
7.872 bln
-796.67 mln
-9.19%
jan 1, 1983
7.452 bln
-419.507 mln
-5.33%
jan 1, 1984
7.137 bln
-315.762 mln
-4.24%
jan 1, 1985
7.287 bln
+150.103 mln
2.1%
jan 1, 1986
7.439 bln
+152.509 mln
2.09%
jan 1, 1987
9.168 bln
+1.729 bln
23.24%
jan 1, 1988
11.055 bln
+1.887 bln
20.58%
jan 1, 1989
12.203 bln
+1.148 bln
10.38%
jan 1, 1990
11.447 bln
-755.835 mln
-6.19%
jan 1, 1991
12.353 bln
+905.816 mln
7.91%
jan 1, 1992
12.134 bln
-219.221 mln
-1.77%
jan 1, 1993
13.067 bln
+933.414 mln
7.69%
jan 1, 1994
12.295 bln
-771.753 mln
-5.91%
jan 1, 1995
13.173 bln
+877.888 mln
7.14%
jan 1, 1996
16.414 bln
+3.241 bln
24.6%
jan 1, 1997
16.456 bln
+42.001 mln
0.26%
jan 1, 1998
16.182 bln
-274.728 mln
-1.67%
jan 1, 1999
16.253 bln
+71.711 mln
0.44%
jan 1, 2000
16.432 bln
+178.607 mln
1.1%
jan 1, 2001
15.149 bln
-1.283 bln
-7.81%
jan 1, 2002
15.505 bln
+356.016 mln
2.35%
jan 1, 2003
17.395 bln
+1.89 bln
12.19%
jan 1, 2004
20.248 bln
+2.853 bln
16.4%
jan 1, 2005
22.562 bln
+2.315 bln
11.43%
jan 1, 2006
25.19 bln
+2.627 bln
11.65%
jan 1, 2007
28.68 bln
+3.49 bln
13.85%
jan 1, 2008
33.223 bln
+4.544 bln
15.84%
jan 1, 2009
35.779 bln
+2.556 bln
7.69%
jan 1, 2010
28.372 bln
-7.407 bln
-20.7%
jan 1, 2011
30.837 bln
+2.465 bln
8.69%
jan 1, 2012
33.648 bln
+2.811 bln
9.12%
jan 1, 2013
33.701 bln
+53.535 mln
0.16%
jan 1, 2014
34.595 bln
+893.989 mln
2.65%
jan 1, 2015
33.928 bln
-667.373 mln
-1.93%
jan 1, 2016
27.628 bln
-6.3 bln
-18.57%
Ranking of countries by current statistics by years


Comments: