29
/
en
AIzaSyAYiBZKx7MnpbEhh9jyipgxe19OcubqV5w
April 1, 2024
158642
Iraq
IRQ
true
2
1
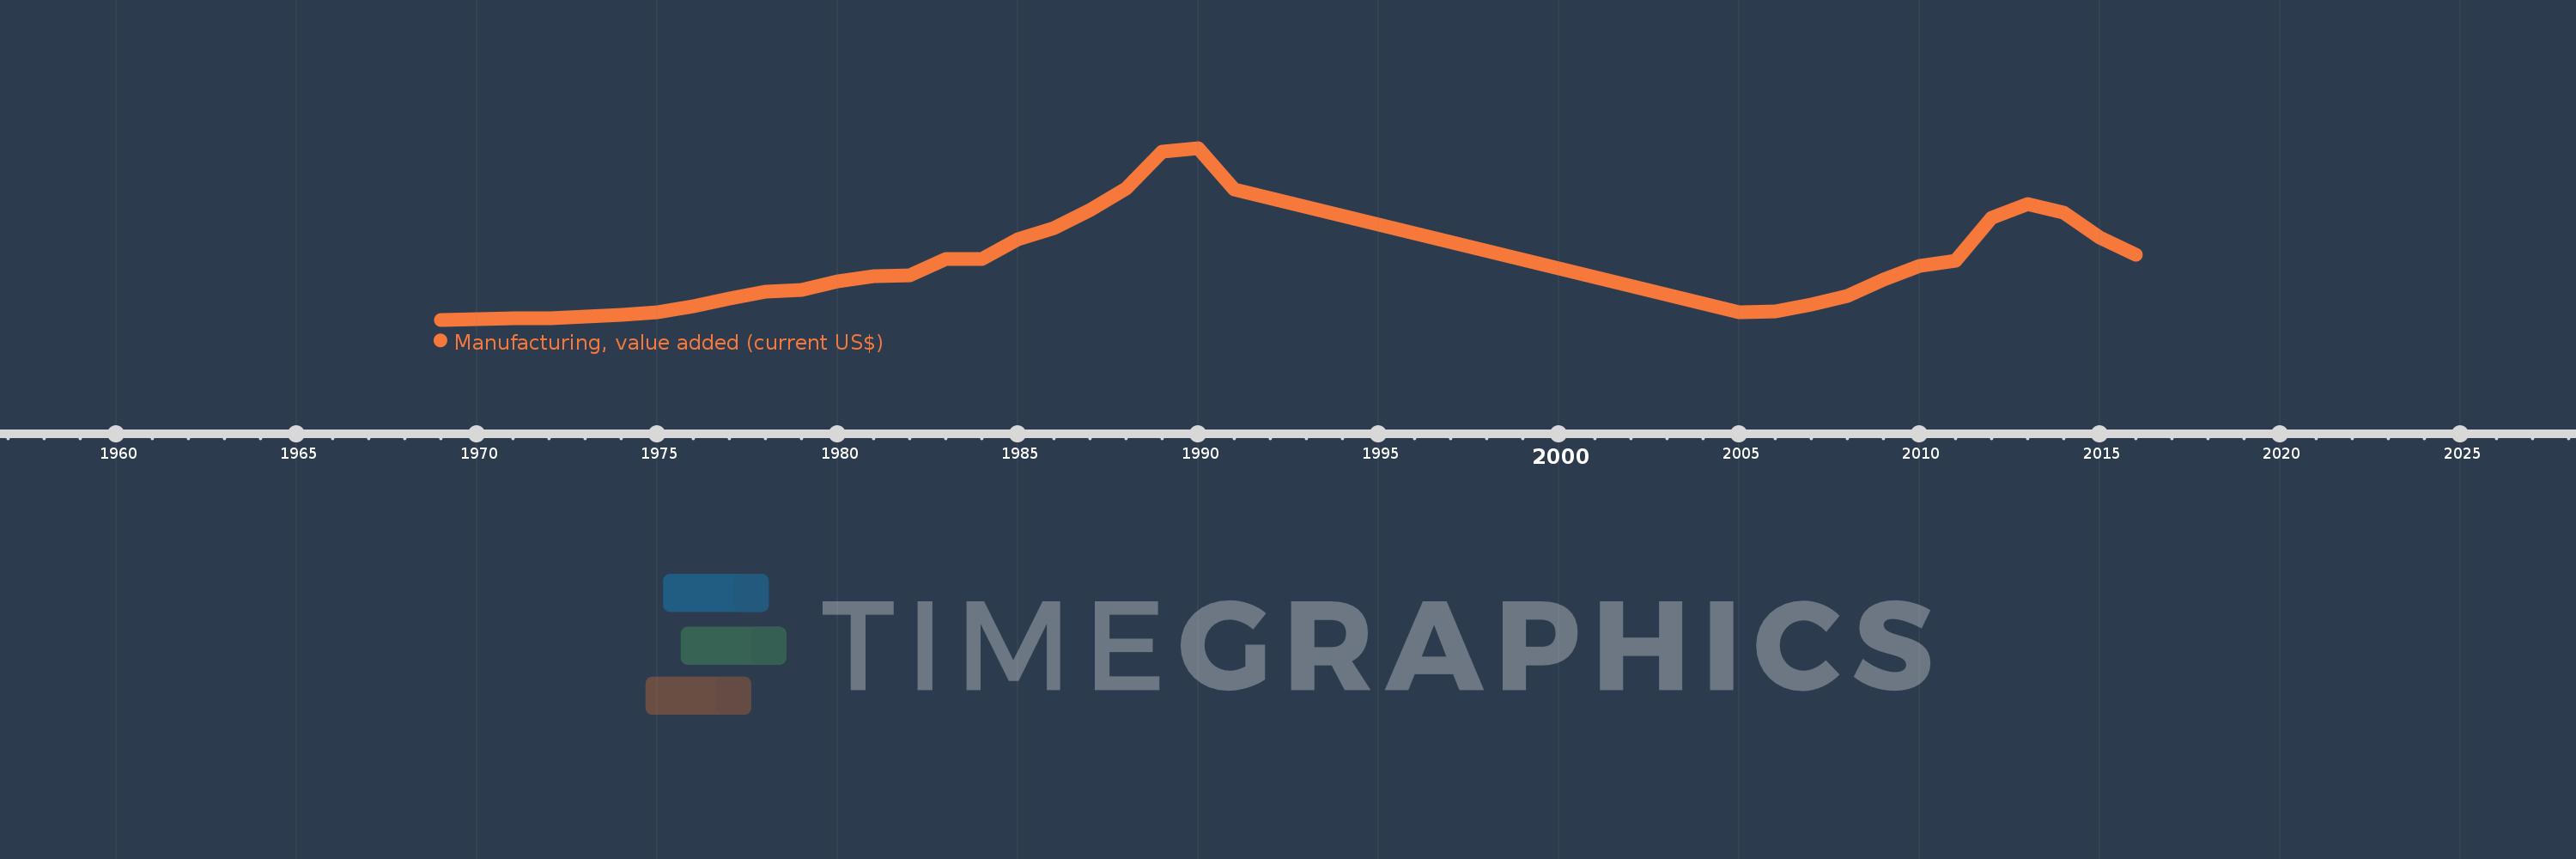
Manufacturing, value added (current US$)
2016,2015,2014,2013,2012,2011,2010,2009,2008,2007,2006,2005,1991,1990,1989,1988,1987,1986,1985,1984,1983,1982,1981,1980,1979,1978,1977,1976,1975,1974,1973,1972,1971,1970,1969
This statistics in other country:
AfghanistanAlbaniaAlgeriaAndorraAngolaAntigua and BarbudaArab WorldArgentinaArmeniaArubaAustraliaAustriaAzerbaijanBahamas, TheBahrainBangladeshBarbadosBelarusBelgiumBelizeBeninBermudaBhutanBoliviaBosnia and HerzegovinaBotswanaBrazilBrunei DarussalamBurkina FasoBurundiCabo VerdeCambodiaCameroonCanadaCaribbean small statesCayman IslandsCentral African RepublicCentral Europe and the BalticsChadChileChinaColombiaComorosCongo, Dem. Rep.Congo, Rep.Costa RicaCote d'IvoireCroatiaCubaCyprusCzech RepublicDenmarkDjiboutiDominicaDominican RepublicEarly-demographic dividendEast Asia & PacificEast Asia & Pacific (excluding high income)East Asia & Pacific (IDA & IBRD countries)EcuadorEgypt, Arab Rep.El SalvadorEquatorial GuineaEritreaEstoniaEthiopiaEuro areaEurope & Central AsiaEurope & Central Asia (excluding high income)Europe & Central Asia (IDA & IBRD countries)European UnionFaroe IslandsFijiFinlandFragile and conflict affected situationsFranceGabonGambia, TheGeorgiaGermanyGhanaGreeceGrenadaGuatemalaGuineaGuinea-BissauGuyanaHeavily indebted poor countries (HIPC)High incomeHondurasHong Kong SAR, ChinaHungaryIBRD onlyIcelandIDA & IBRD totalIDA blendIDA onlyIDA totalIndiaIndonesiaIran, Islamic Rep.IraqIrelandItalyJamaicaJapanJordanKazakhstanKenyaKiribatiKorea, Rep.KosovoKuwaitKyrgyz RepublicLao PDRLate-demographic dividendLatin America & Caribbean Latin America & Caribbean (excluding high income)Latin America & the Caribbean (IDA & IBRD countries)LatviaLeast developed countries: UN classificationLebanonLesothoLiberiaLibyaLithuaniaLow & middle incomeLow incomeLower middle incomeLuxembourgMacao SAR, ChinaMacedonia, FYRMadagascarMalawiMalaysiaMaldivesMaliMaltaMarshall IslandsMauritaniaMauritiusMexicoMicronesia, Fed. Sts.Middle East & North AfricaMiddle East & North Africa (excluding high income)Middle East & North Africa (IDA & IBRD countries)Middle incomeMoldovaMongoliaMontenegroMoroccoMozambiqueMyanmarNamibiaNepalNetherlandsNew CaledoniaNew ZealandNicaraguaNigerNigeriaNorth AmericaNorwayOECD membersOmanOther small statesPacific island small statesPakistanPalauPanamaPapua New GuineaParaguayPeruPhilippinesPolandPortugalPost-demographic dividendPre-demographic dividendPuerto RicoQatarRomaniaRussian FederationRwandaSamoaSao Tome and PrincipeSaudi ArabiaSenegalSerbiaSeychellesSierra LeoneSingaporeSlovak RepublicSloveniaSmall statesSolomon IslandsSouth AfricaSouth AsiaSouth Asia (IDA & IBRD)SpainSri LankaSt. Kitts and NevisSt. LuciaSt. Vincent and the GrenadinesSub-Saharan Africa Sub-Saharan Africa (excluding high income)Sub-Saharan Africa (IDA & IBRD countries)SudanSurinameSwazilandSwedenSwitzerlandSyrian Arab RepublicTajikistanTanzaniaThailandTimor-LesteTogoTongaTrinidad and TobagoTunisiaTurkeyTurkmenistanTuvaluUgandaUkraineUnited Arab EmiratesUnited KingdomUnited StatesUpper middle incomeUruguayUzbekistanVanuatuVenezuela, RBVietnamWest Bank and GazaWorldYemen, Rep.ZambiaZimbabwe Timeline:
This timeline shows a graph from 1969 to 2016 of Iraq. No data until 1968. Number of actual observations by date: 35.
Source name:
World Development Indicators
Source organization:
World Bank national accounts data, and OECD National Accounts data files.
Categories, topics:
Economy & Growth
Last updated:
apr 23, 2017
Indicators value changes by year
Minimum:
264.912 mln
jan 1, 1969
Maximum:
8.666 bln
jan 1, 1990
At the date of observation
Value
Absolute change
Change from previous value
jan 1, 1969
264.912 mln
+264.912 mln
0.0%
jan 1, 1970
288.435 mln
+23.523 mln
8.88%
jan 1, 1971
324.839 mln
+36.404 mln
12.62%
jan 1, 1972
335.219 mln
+10.38 mln
3.2%
jan 1, 1973
420.547 mln
+85.327 mln
25.45%
jan 1, 1974
520.304 mln
+99.757 mln
23.72%
jan 1, 1975
635.963 mln
+115.66 mln
22.23%
jan 1, 1976
916.356 mln
+280.393 mln
44.09%
jan 1, 1977
1.286 bln
+369.793 mln
40.35%
jan 1, 1978
1.655 bln
+368.439 mln
28.65%
jan 1, 1979
1.714 bln
+59.6 mln
3.6%
jan 1, 1980
2.129 bln
+414.494 mln
24.18%
jan 1, 1981
2.412 bln
+283.102 mln
13.3%
jan 1, 1982
2.447 bln
+35.218 mln
1.46%
jan 1, 1983
3.255 bln
+807.603 mln
33.0%
jan 1, 1984
3.255 bln
+781.219K
0.02%
jan 1, 1985
4.184 bln
+928.273 mln
28.51%
jan 1, 1986
4.76 bln
+576.391 mln
13.78%
jan 1, 1987
5.647 bln
+887.424 mln
18.64%
jan 1, 1988
6.662 bln
+1.014 bln
17.96%
jan 1, 1989
8.495 bln
+1.833 bln
27.52%
jan 1, 1990
8.666 bln
+171.116 mln
2.01%
jan 1, 1991
6.622 bln
-2.044 bln
-23.59%
jan 1, 2005
645.16 mln
-5.977 bln
-90.26%
jan 1, 2006
659.668 mln
+14.508 mln
2.25%
jan 1, 2007
1.004 bln
+344.286 mln
52.19%
jan 1, 2008
1.449 bln
+445.083 mln
44.33%
jan 1, 2009
2.216 bln
+767.215 mln
52.95%
jan 1, 2010
2.916 bln
+699.382 mln
31.56%
jan 1, 2011
3.144 bln
+228.566 mln
7.84%
jan 1, 2012
5.242 bln
+2.097 bln
66.71%
jan 1, 2013
5.933 bln
+691.823 mln
13.2%
jan 1, 2014
5.491 bln
-442.718 mln
-7.46%
jan 1, 2015
4.288 bln
-1.203 bln
-21.91%
jan 1, 2016
3.436 bln
-851.562 mln
-19.86%
Ranking of countries by current statistics by years


Comments: