29
/
en
AIzaSyAYiBZKx7MnpbEhh9jyipgxe19OcubqV5w
April 1, 2024
231308
Rwanda
RWA
true
2
1
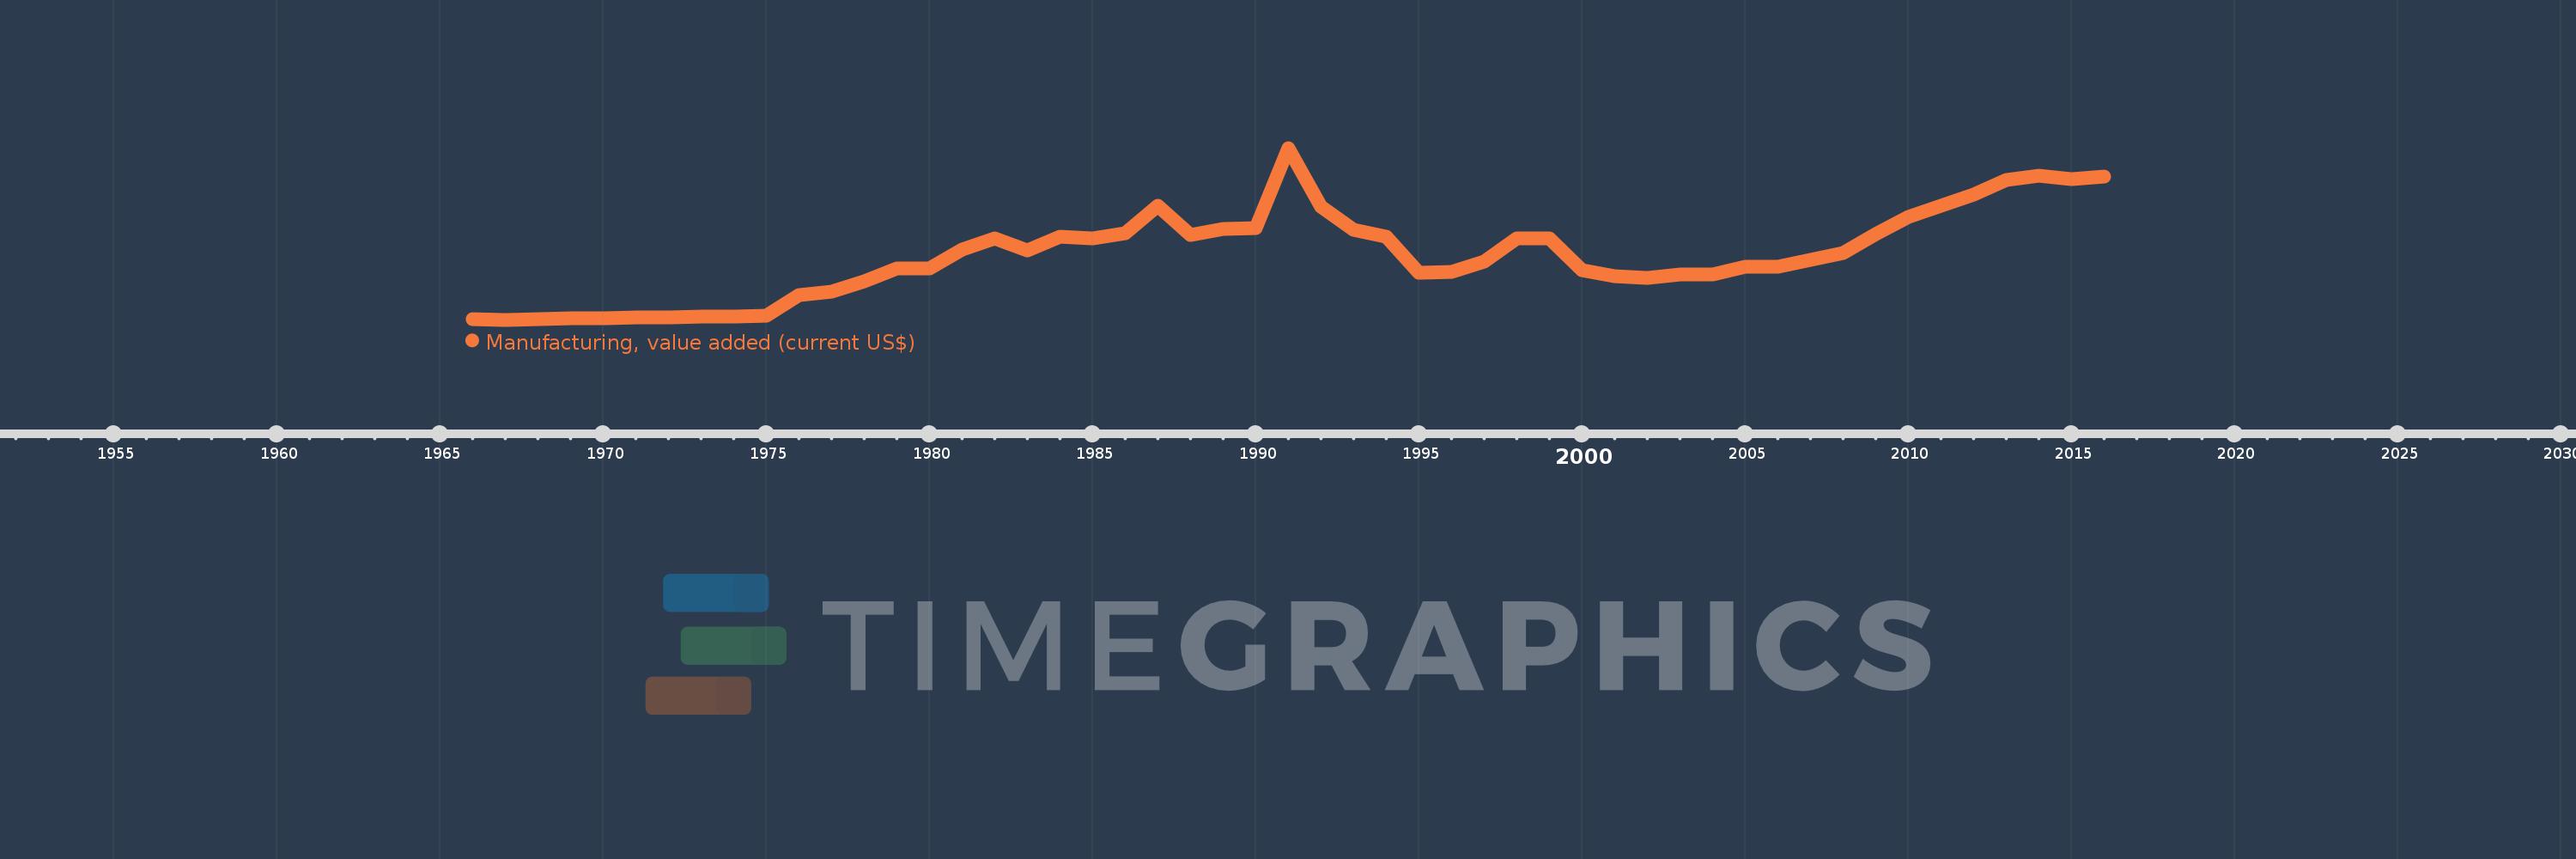
Manufacturing, value added (current US$)
2016,2015,2014,2013,2012,2011,2010,2009,2008,2007,2006,2005,2004,2003,2002,2001,2000,1999,1998,1997,1996,1995,1994,1993,1992,1991,1990,1989,1988,1987,1986,1985,1984,1983,1982,1981,1980,1979,1978,1977,1976,1975,1974,1973,1972,1971,1970,1969,1968,1967,1966
This statistics in other country:
AfghanistanAlbaniaAlgeriaAndorraAngolaAntigua and BarbudaArab WorldArgentinaArmeniaArubaAustraliaAustriaAzerbaijanBahamas, TheBahrainBangladeshBarbadosBelarusBelgiumBelizeBeninBermudaBhutanBoliviaBosnia and HerzegovinaBotswanaBrazilBrunei DarussalamBurkina FasoBurundiCabo VerdeCambodiaCameroonCanadaCaribbean small statesCayman IslandsCentral African RepublicCentral Europe and the BalticsChadChileChinaColombiaComorosCongo, Dem. Rep.Congo, Rep.Costa RicaCote d'IvoireCroatiaCubaCyprusCzech RepublicDenmarkDjiboutiDominicaDominican RepublicEarly-demographic dividendEast Asia & PacificEast Asia & Pacific (excluding high income)East Asia & Pacific (IDA & IBRD countries)EcuadorEgypt, Arab Rep.El SalvadorEquatorial GuineaEritreaEstoniaEthiopiaEuro areaEurope & Central AsiaEurope & Central Asia (excluding high income)Europe & Central Asia (IDA & IBRD countries)European UnionFaroe IslandsFijiFinlandFragile and conflict affected situationsFranceGabonGambia, TheGeorgiaGermanyGhanaGreeceGrenadaGuatemalaGuineaGuinea-BissauGuyanaHeavily indebted poor countries (HIPC)High incomeHondurasHong Kong SAR, ChinaHungaryIBRD onlyIcelandIDA & IBRD totalIDA blendIDA onlyIDA totalIndiaIndonesiaIran, Islamic Rep.IraqIrelandItalyJamaicaJapanJordanKazakhstanKenyaKiribatiKorea, Rep.KosovoKuwaitKyrgyz RepublicLao PDRLate-demographic dividendLatin America & Caribbean Latin America & Caribbean (excluding high income)Latin America & the Caribbean (IDA & IBRD countries)LatviaLeast developed countries: UN classificationLebanonLesothoLiberiaLibyaLithuaniaLow & middle incomeLow incomeLower middle incomeLuxembourgMacao SAR, ChinaMacedonia, FYRMadagascarMalawiMalaysiaMaldivesMaliMaltaMarshall IslandsMauritaniaMauritiusMexicoMicronesia, Fed. Sts.Middle East & North AfricaMiddle East & North Africa (excluding high income)Middle East & North Africa (IDA & IBRD countries)Middle incomeMoldovaMongoliaMontenegroMoroccoMozambiqueMyanmarNamibiaNepalNetherlandsNew CaledoniaNew ZealandNicaraguaNigerNigeriaNorth AmericaNorwayOECD membersOmanOther small statesPacific island small statesPakistanPalauPanamaPapua New GuineaParaguayPeruPhilippinesPolandPortugalPost-demographic dividendPre-demographic dividendPuerto RicoQatarRomaniaRussian FederationRwandaSamoaSao Tome and PrincipeSaudi ArabiaSenegalSerbiaSeychellesSierra LeoneSingaporeSlovak RepublicSloveniaSmall statesSolomon IslandsSouth AfricaSouth AsiaSouth Asia (IDA & IBRD)SpainSri LankaSt. Kitts and NevisSt. LuciaSt. Vincent and the GrenadinesSub-Saharan Africa Sub-Saharan Africa (excluding high income)Sub-Saharan Africa (IDA & IBRD countries)SudanSurinameSwazilandSwedenSwitzerlandSyrian Arab RepublicTajikistanTanzaniaThailandTimor-LesteTogoTongaTrinidad and TobagoTunisiaTurkeyTurkmenistanTuvaluUgandaUkraineUnited Arab EmiratesUnited KingdomUnited StatesUpper middle incomeUruguayUzbekistanVanuatuVenezuela, RBVietnamWest Bank and GazaWorldYemen, Rep.ZambiaZimbabwe Timeline:
This timeline shows a graph from 1966 to 2016 of Rwanda. No data until 1965. Number of actual observations by date: 51.
Source name:
World Development Indicators
Source organization:
World Bank national accounts data, and OECD National Accounts data files.
Categories, topics:
Economy & Growth
Last updated:
apr 23, 2017
Indicators value changes by year
Minimum:
2.562 mln
jan 1, 1967
Maximum:
466.811 mln
jan 1, 1991
At the date of observation
Value
Absolute change
Change from previous value
jan 1, 1966
3.06 mln
+3.06 mln
0.0%
jan 1, 1967
2.562 mln
-497.714K
-16.27%
jan 1, 1968
3.925 mln
+1.363 mln
53.18%
jan 1, 1969
7.519 mln
+3.594 mln
91.57%
jan 1, 1970
7.654 mln
+134.999K
1.8%
jan 1, 1971
7.9 mln
+246.003K
3.21%
jan 1, 1972
8.324 mln
+424.365K
5.37%
jan 1, 1973
10.097 mln
+1.773 mln
21.3%
jan 1, 1974
11.916 mln
+1.819 mln
18.01%
jan 1, 1975
13.444 mln
+1.528 mln
12.82%
jan 1, 1976
70.223 mln
+56.779 mln
422.34%
jan 1, 1977
78.341 mln
+8.117 mln
11.56%
jan 1, 1978
106.322 mln
+27.981 mln
35.72%
jan 1, 1979
141.248 mln
+34.926 mln
32.85%
jan 1, 1980
141.884 mln
+635.589K
0.45%
jan 1, 1981
191.486 mln
+49.602 mln
34.96%
jan 1, 1982
221.431 mln
+29.945 mln
15.64%
jan 1, 1983
189.738 mln
-31.693 mln
-14.31%
jan 1, 1984
227.205 mln
+37.467 mln
19.75%
jan 1, 1985
221.524 mln
-5.681 mln
-2.5%
jan 1, 1986
235.41 mln
+13.886 mln
6.27%
jan 1, 1987
309.747 mln
+74.337 mln
31.58%
jan 1, 1988
232.052 mln
-77.695 mln
-25.08%
jan 1, 1989
248.053 mln
+16.001 mln
6.9%
jan 1, 1990
251.099 mln
+3.045 mln
1.23%
jan 1, 1991
466.811 mln
+215.712 mln
85.91%
jan 1, 1992
308.531 mln
-158.28 mln
-33.91%
jan 1, 1993
245.635 mln
-62.896 mln
-20.39%
jan 1, 1994
226.329 mln
-19.306 mln
-7.86%
jan 1, 1995
130.0 mln
-96.329 mln
-42.56%
jan 1, 1996
132.202 mln
+2.202 mln
1.69%
jan 1, 1997
159.589 mln
+27.387 mln
20.72%
jan 1, 1998
222.864 mln
+63.275 mln
39.65%
jan 1, 1999
223.493 mln
+629.412K
0.28%
jan 1, 2000
136.969 mln
-86.524 mln
-38.71%
jan 1, 2001
120.914 mln
-16.054 mln
-11.72%
jan 1, 2002
115.695 mln
-5.219 mln
-4.32%
jan 1, 2003
125.588 mln
+9.892 mln
8.55%
jan 1, 2004
125.359 mln
-228.455K
-0.18%
jan 1, 2005
144.948 mln
+19.589 mln
15.63%
jan 1, 2006
145.207 mln
+259.589K
0.18%
jan 1, 2007
164.942 mln
+19.734 mln
13.59%
jan 1, 2008
182.83 mln
+17.889 mln
10.85%
jan 1, 2009
234.068 mln
+51.238 mln
28.02%
jan 1, 2010
279.791 mln
+45.723 mln
19.53%
jan 1, 2011
310.393 mln
+30.602 mln
10.94%
jan 1, 2012
339.826 mln
+29.433 mln
9.48%
jan 1, 2013
380.924 mln
+41.098 mln
12.09%
jan 1, 2014
391.256 mln
+10.331 mln
2.71%
jan 1, 2015
382.776 mln
-8.48 mln
-2.17%
jan 1, 2016
389.75 mln
+6.974 mln
1.82%
Ranking of countries by current statistics by years


Comments: