29
/
en
AIzaSyAYiBZKx7MnpbEhh9jyipgxe19OcubqV5w
April 1, 2024
46294
Low income
LIC
false
2
1
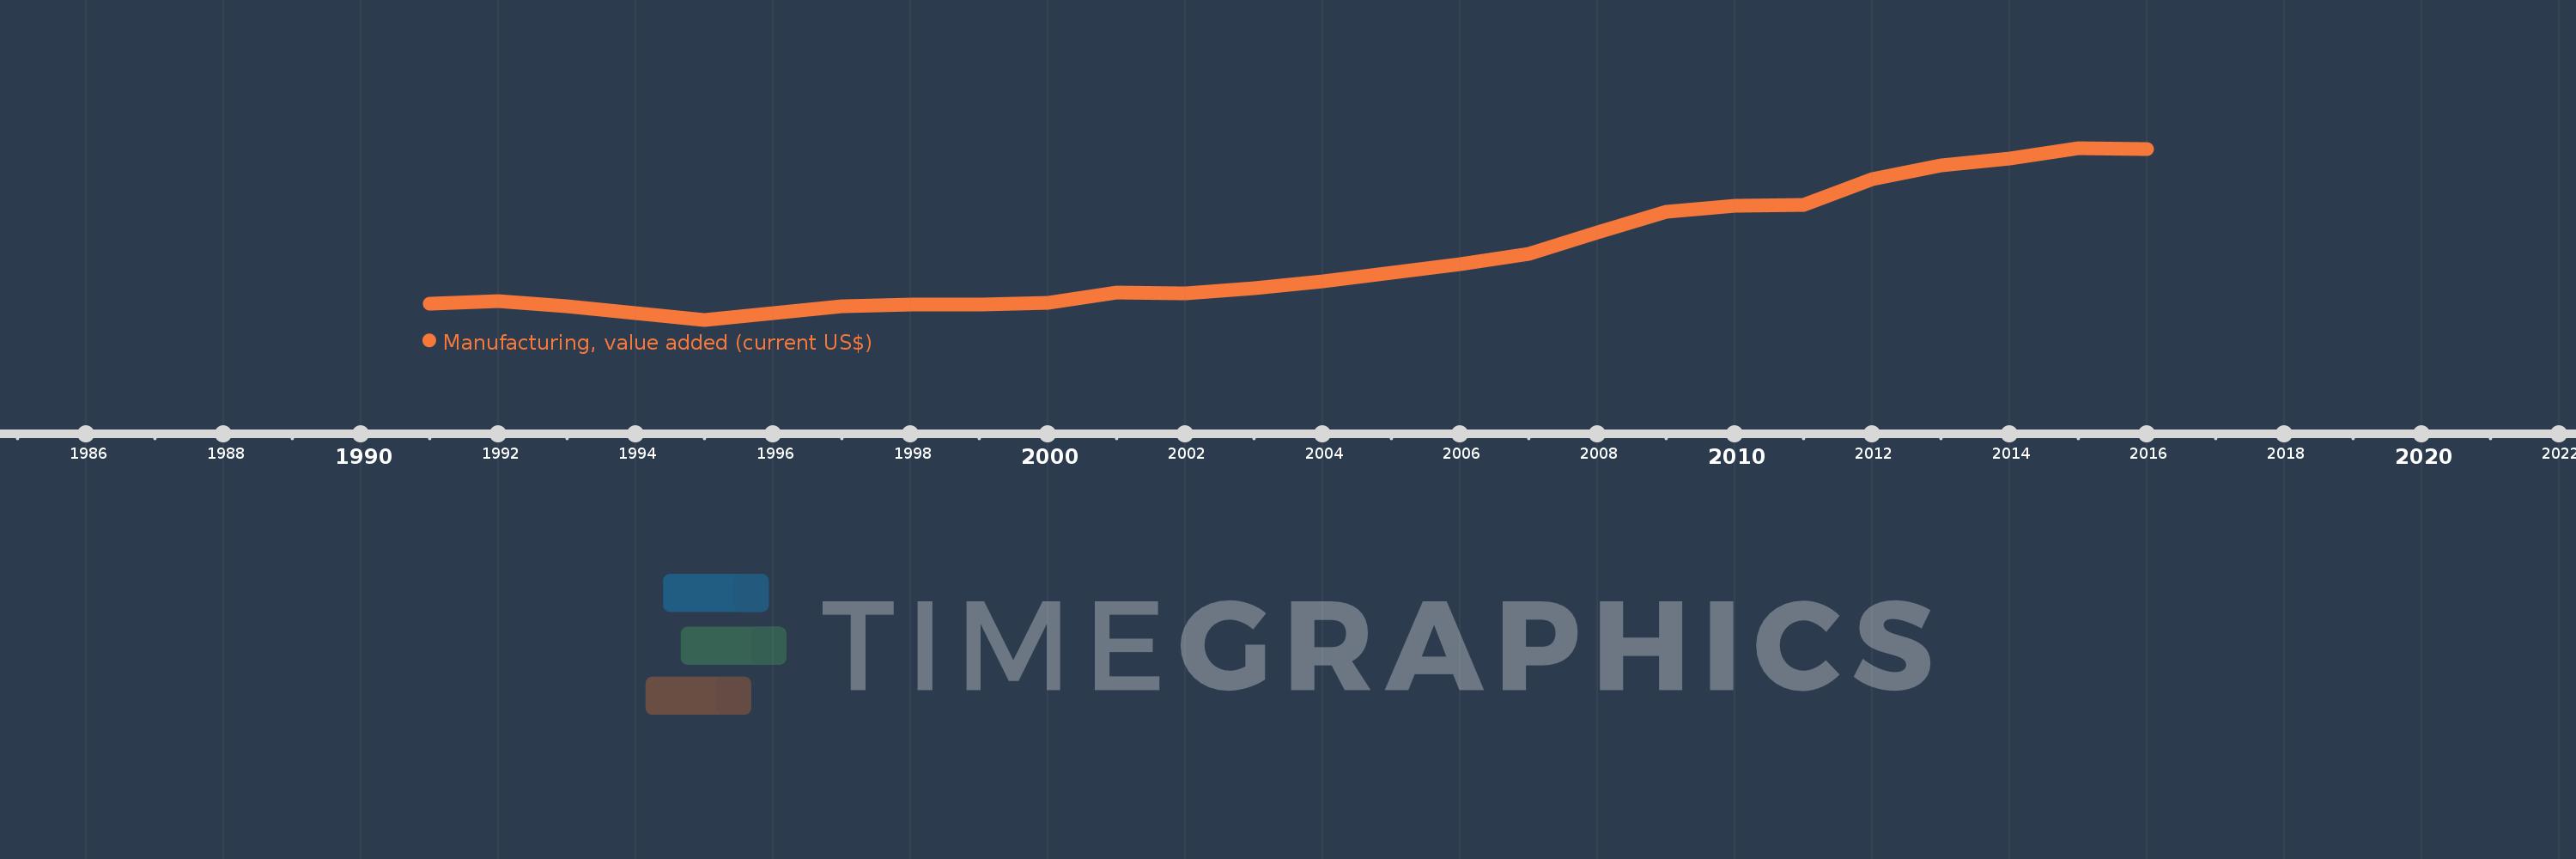
Manufacturing, value added (current US$)
2016,2015,2014,2013,2012,2011,2010,2009,2008,2007,2006,2005,2004,2003,2002,2001,2000,1999,1998,1997,1996,1995,1994,1993,1992,1991
This statistics in other country:
AfghanistanAlbaniaAlgeriaAndorraAngolaAntigua and BarbudaArab WorldArgentinaArmeniaArubaAustraliaAustriaAzerbaijanBahamas, TheBahrainBangladeshBarbadosBelarusBelgiumBelizeBeninBermudaBhutanBoliviaBosnia and HerzegovinaBotswanaBrazilBrunei DarussalamBurkina FasoBurundiCabo VerdeCambodiaCameroonCanadaCaribbean small statesCayman IslandsCentral African RepublicCentral Europe and the BalticsChadChileChinaColombiaComorosCongo, Dem. Rep.Congo, Rep.Costa RicaCote d'IvoireCroatiaCubaCyprusCzech RepublicDenmarkDjiboutiDominicaDominican RepublicEarly-demographic dividendEast Asia & PacificEast Asia & Pacific (excluding high income)East Asia & Pacific (IDA & IBRD countries)EcuadorEgypt, Arab Rep.El SalvadorEquatorial GuineaEritreaEstoniaEthiopiaEuro areaEurope & Central AsiaEurope & Central Asia (excluding high income)Europe & Central Asia (IDA & IBRD countries)European UnionFaroe IslandsFijiFinlandFragile and conflict affected situationsFranceGabonGambia, TheGeorgiaGermanyGhanaGreeceGrenadaGuatemalaGuineaGuinea-BissauGuyanaHeavily indebted poor countries (HIPC)High incomeHondurasHong Kong SAR, ChinaHungaryIBRD onlyIcelandIDA & IBRD totalIDA blendIDA onlyIDA totalIndiaIndonesiaIran, Islamic Rep.IraqIrelandItalyJamaicaJapanJordanKazakhstanKenyaKiribatiKorea, Rep.KosovoKuwaitKyrgyz RepublicLao PDRLate-demographic dividendLatin America & Caribbean Latin America & Caribbean (excluding high income)Latin America & the Caribbean (IDA & IBRD countries)LatviaLeast developed countries: UN classificationLebanonLesothoLiberiaLibyaLithuaniaLow & middle incomeLow incomeLower middle incomeLuxembourgMacao SAR, ChinaMacedonia, FYRMadagascarMalawiMalaysiaMaldivesMaliMaltaMarshall IslandsMauritaniaMauritiusMexicoMicronesia, Fed. Sts.Middle East & North AfricaMiddle East & North Africa (excluding high income)Middle East & North Africa (IDA & IBRD countries)Middle incomeMoldovaMongoliaMontenegroMoroccoMozambiqueMyanmarNamibiaNepalNetherlandsNew CaledoniaNew ZealandNicaraguaNigerNigeriaNorth AmericaNorwayOECD membersOmanOther small statesPacific island small statesPakistanPalauPanamaPapua New GuineaParaguayPeruPhilippinesPolandPortugalPost-demographic dividendPre-demographic dividendPuerto RicoQatarRomaniaRussian FederationRwandaSamoaSao Tome and PrincipeSaudi ArabiaSenegalSerbiaSeychellesSierra LeoneSingaporeSlovak RepublicSloveniaSmall statesSolomon IslandsSouth AfricaSouth AsiaSouth Asia (IDA & IBRD)SpainSri LankaSt. Kitts and NevisSt. LuciaSt. Vincent and the GrenadinesSub-Saharan Africa Sub-Saharan Africa (excluding high income)Sub-Saharan Africa (IDA & IBRD countries)SudanSurinameSwazilandSwedenSwitzerlandSyrian Arab RepublicTajikistanTanzaniaThailandTimor-LesteTogoTongaTrinidad and TobagoTunisiaTurkeyTurkmenistanTuvaluUgandaUkraineUnited Arab EmiratesUnited KingdomUnited StatesUpper middle incomeUruguayUzbekistanVanuatuVenezuela, RBVietnamWest Bank and GazaWorldYemen, Rep.ZambiaZimbabwe Timeline:
This timeline shows a graph from 1991 to 2016 of Low income. No data until 1990. Number of actual observations by date: 26.
Source name:
World Development Indicators
Source organization:
World Bank national accounts data, and OECD National Accounts data files.
Categories, topics:
Economy & Growth
Last updated:
apr 23, 2017
Indicators value changes by year
Minimum:
7.39 bln
jan 1, 1995
Maximum:
34.996 bln
jan 1, 2015
At the date of observation
Value
Absolute change
Change from previous value
jan 1, 1991
10.008 bln
+10.008 bln
0.0%
jan 1, 1992
10.359 bln
+350.753 mln
3.5%
jan 1, 1993
9.497 bln
-862.583 mln
-8.33%
jan 1, 1994
8.42 bln
-1.076 bln
-11.33%
jan 1, 1995
7.39 bln
-1.03 bln
-12.23%
jan 1, 1996
8.443 bln
+1.052 bln
14.24%
jan 1, 1997
9.504 bln
+1.062 bln
12.58%
jan 1, 1998
9.812 bln
+308.039 mln
3.24%
jan 1, 1999
9.797 bln
-15.758 mln
-0.16%
jan 1, 2000
10.107 bln
+310.877 mln
3.17%
jan 1, 2001
11.77 bln
+1.663 bln
16.45%
jan 1, 2002
11.646 bln
-123.83 mln
-1.05%
jan 1, 2003
12.402 bln
+755.92 mln
6.49%
jan 1, 2004
13.505 bln
+1.102 bln
8.89%
jan 1, 2005
14.993 bln
+1.489 bln
11.02%
jan 1, 2006
16.265 bln
+1.272 bln
8.48%
jan 1, 2007
18.02 bln
+1.755 bln
10.79%
jan 1, 2008
21.415 bln
+3.395 bln
18.84%
jan 1, 2009
24.775 bln
+3.36 bln
15.69%
jan 1, 2010
25.757 bln
+982.207 mln
3.96%
jan 1, 2011
25.8 bln
+43.482 mln
0.17%
jan 1, 2012
29.985 bln
+4.185 bln
16.22%
jan 1, 2013
32.173 bln
+2.188 bln
7.3%
jan 1, 2014
33.317 bln
+1.144 bln
3.56%
jan 1, 2015
34.996 bln
+1.678 bln
5.04%
jan 1, 2016
34.75 bln
-245.776 mln
-0.7%
Ranking of countries by current statistics by years


Comments: