29
/
en
AIzaSyAYiBZKx7MnpbEhh9jyipgxe19OcubqV5w
April 1, 2024
34028
Fragile and conflict affected situations
FCS
false
2
1
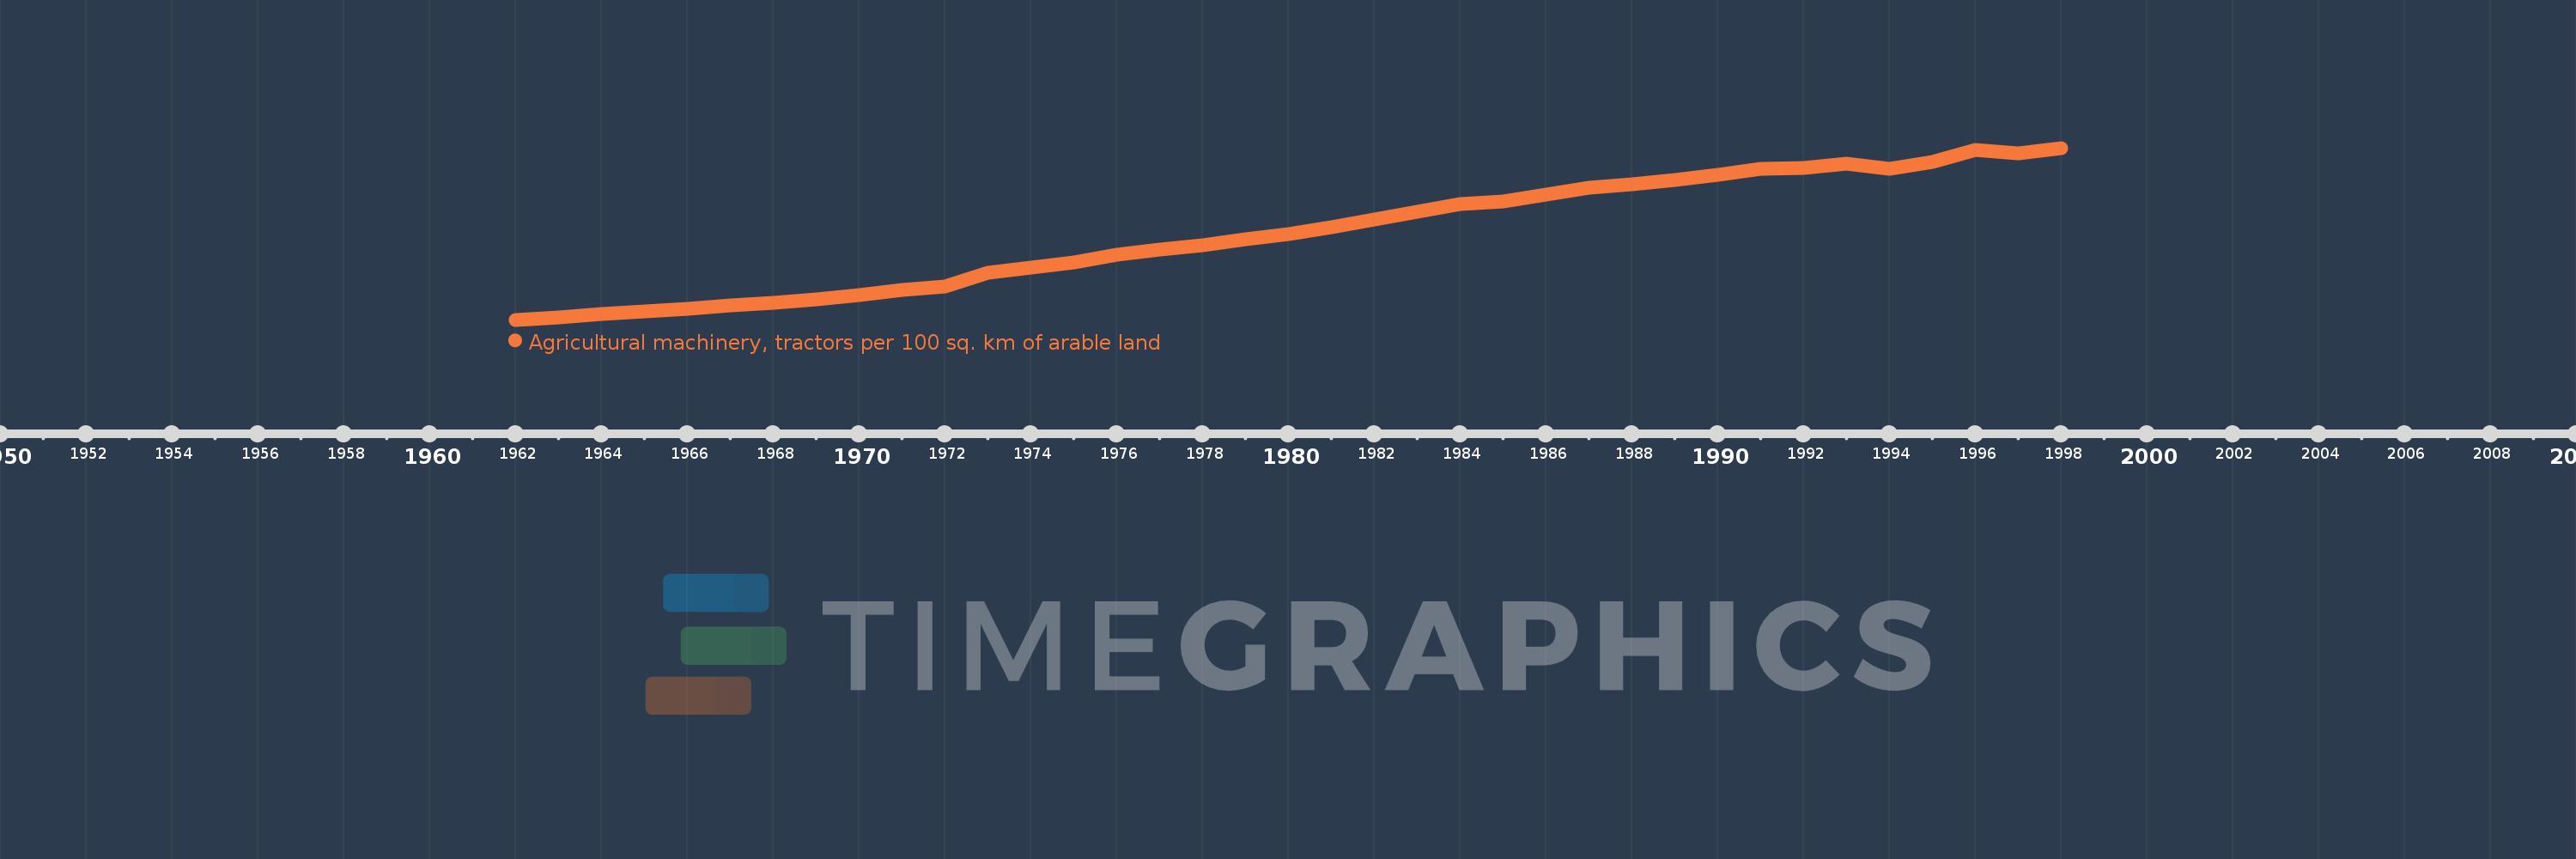
Agricultural machinery, tractors per 100 sq. km of arable land
1998,1997,1996,1995,1994,1993,1992,1991,1990,1989,1988,1987,1986,1985,1984,1983,1982,1981,1980,1979,1978,1977,1976,1975,1974,1973,1972,1971,1970,1969,1968,1967,1966,1965,1964,1963,1962
This statistics in other country:
AfghanistanAlbaniaAlgeriaAmerican SamoaAndorraAngolaAntigua and BarbudaArab WorldArgentinaArmeniaAustraliaAustriaAzerbaijanBahamas, TheBahrainBangladeshBarbadosBelarusBelgiumBelizeBeninBermudaBhutanBoliviaBosnia and HerzegovinaBotswanaBrazilBritish Virgin IslandsBrunei DarussalamBulgariaBurkina FasoBurundiCabo VerdeCambodiaCameroonCanadaCaribbean small statesCentral African RepublicCentral Europe and the BalticsChadChileChinaColombiaCongo, Dem. Rep.Congo, Rep.Costa RicaCote d'IvoireCroatiaCubaCyprusCzech RepublicDenmarkDjiboutiDominicaDominican RepublicEarly-demographic dividendEast Asia & PacificEast Asia & Pacific (excluding high income)East Asia & Pacific (IDA & IBRD countries)EcuadorEgypt, Arab Rep.El SalvadorEritreaEstoniaEuro areaEurope & Central AsiaEurope & Central Asia (excluding high income)Europe & Central Asia (IDA & IBRD countries)European UnionFijiFinlandFragile and conflict affected situationsFranceFrench PolynesiaGambia, TheGeorgiaGermanyGhanaGreeceGrenadaGuamGuatemalaGuineaGuinea-BissauGuyanaHaitiHeavily indebted poor countries (HIPC)High incomeHondurasHungaryIBRD onlyIcelandIDA & IBRD totalIDA blendIDA onlyIDA totalIndiaIndonesiaIran, Islamic Rep.IraqIrelandIsraelItalyJamaicaJapanJordanKazakhstanKenyaKiribatiKorea, Dem. People’s Rep.Korea, Rep.KuwaitKyrgyz RepublicLao PDRLate-demographic dividendLatin America & Caribbean Latin America & Caribbean (excluding high income)Latin America & the Caribbean (IDA & IBRD countries)LatviaLeast developed countries: UN classificationLebanonLesothoLibyaLiechtensteinLithuaniaLow & middle incomeLow incomeLower middle incomeLuxembourgMacedonia, FYRMadagascarMalawiMalaysiaMaliMaltaMauritaniaMauritiusMexicoMiddle East & North AfricaMiddle East & North Africa (excluding high income)Middle East & North Africa (IDA & IBRD countries)Middle incomeMoldovaMongoliaMoroccoMozambiqueMyanmarNepalNetherlandsNew CaledoniaNew ZealandNicaraguaNigerNigeriaNorth AmericaNorthern Mariana IslandsNorwayOECD membersOmanOther small statesPakistanPanamaPapua New GuineaParaguayPeruPhilippinesPolandPortugalPost-demographic dividendPre-demographic dividendPuerto RicoQatarRomaniaRussian FederationRwandaSamoaSao Tome and PrincipeSaudi ArabiaSenegalSerbiaSeychellesSierra LeoneSlovak RepublicSloveniaSmall statesSolomon IslandsSomaliaSouth AfricaSouth AsiaSouth Asia (IDA & IBRD)SpainSri LankaSt. Kitts and NevisSt. LuciaSt. Vincent and the GrenadinesSub-Saharan Africa Sub-Saharan Africa (excluding high income)Sub-Saharan Africa (IDA & IBRD countries)SudanSurinameSwazilandSwedenSwitzerlandSyrian Arab RepublicTajikistanTanzaniaThailandTimor-LesteTogoTongaTrinidad and TobagoTunisiaTurkeyTurkmenistanUgandaUkraineUnited Arab EmiratesUnited KingdomUnited StatesUpper middle incomeUruguayVanuatuVenezuela, RBVietnamVirgin Islands (U.S.)West Bank and GazaWorldYemen, Rep.ZambiaZimbabwe Timeline:
This timeline shows a graph from 1962 to 1998 of Fragile and conflict affected situations. No data until 1961. Number of actual observations by date: 37.
Source name:
World Development Indicators
Source organization:
Food and Agriculture Organization, electronic files and web site.
Categories, topics:
Agriculture & Rural Development
Last updated:
apr 23, 2017
Indicators value changes by year
Maximum:
37.402
jan 1, 1998
At the date of observation
Value
Absolute change
Change from previous value
jan 1, 1962
4.69
+4.69
0.0%
jan 1, 1963
5.189
+0.499
10.65%
jan 1, 1964
5.728
+0.539
10.39%
jan 1, 1965
6.21
+0.481
8.4%
jan 1, 1966
6.725
+0.515
8.3%
jan 1, 1967
7.477
+0.752
11.18%
jan 1, 1968
7.939
+0.462
6.18%
jan 1, 1969
8.538
+0.599
7.55%
jan 1, 1970
9.393
+0.855
10.02%
jan 1, 1971
10.359
+0.965
10.28%
jan 1, 1972
10.989
+0.631
6.09%
jan 1, 1973
13.627
+2.638
24.0%
jan 1, 1974
14.61
+0.983
7.22%
jan 1, 1975
15.601
+0.991
6.78%
jan 1, 1976
17.131
+1.53
9.81%
jan 1, 1977
18.041
+0.911
5.32%
jan 1, 1978
18.814
+0.772
4.28%
jan 1, 1979
20.011
+1.198
6.37%
jan 1, 1980
20.983
+0.971
4.85%
jan 1, 1981
22.347
+1.364
6.5%
jan 1, 1982
23.719
+1.372
6.14%
jan 1, 1983
25.22
+1.501
6.33%
jan 1, 1984
26.705
+1.484
5.88%
jan 1, 1985
27.142
+0.438
1.64%
jan 1, 1986
28.546
+1.404
5.17%
jan 1, 1987
29.803
+1.257
4.4%
jan 1, 1988
30.47
+0.666
2.24%
jan 1, 1989
31.338
+0.868
2.85%
jan 1, 1990
32.364
+1.026
3.27%
jan 1, 1991
33.416
+1.053
3.25%
jan 1, 1992
33.629
+0.212
0.63%
jan 1, 1993
34.366
+0.738
2.19%
jan 1, 1994
33.5
-0.867
-2.52%
jan 1, 1995
34.77
+1.27
3.79%
jan 1, 1996
37.008
+2.238
6.44%
jan 1, 1997
36.295
-0.713
-1.93%
jan 1, 1998
37.402
+1.107
3.05%
Ranking of countries by current statistics by years


Comments: