29
/
en
AIzaSyAYiBZKx7MnpbEhh9jyipgxe19OcubqV5w
April 1, 2024
100826
Canada
CAN
true
2
1
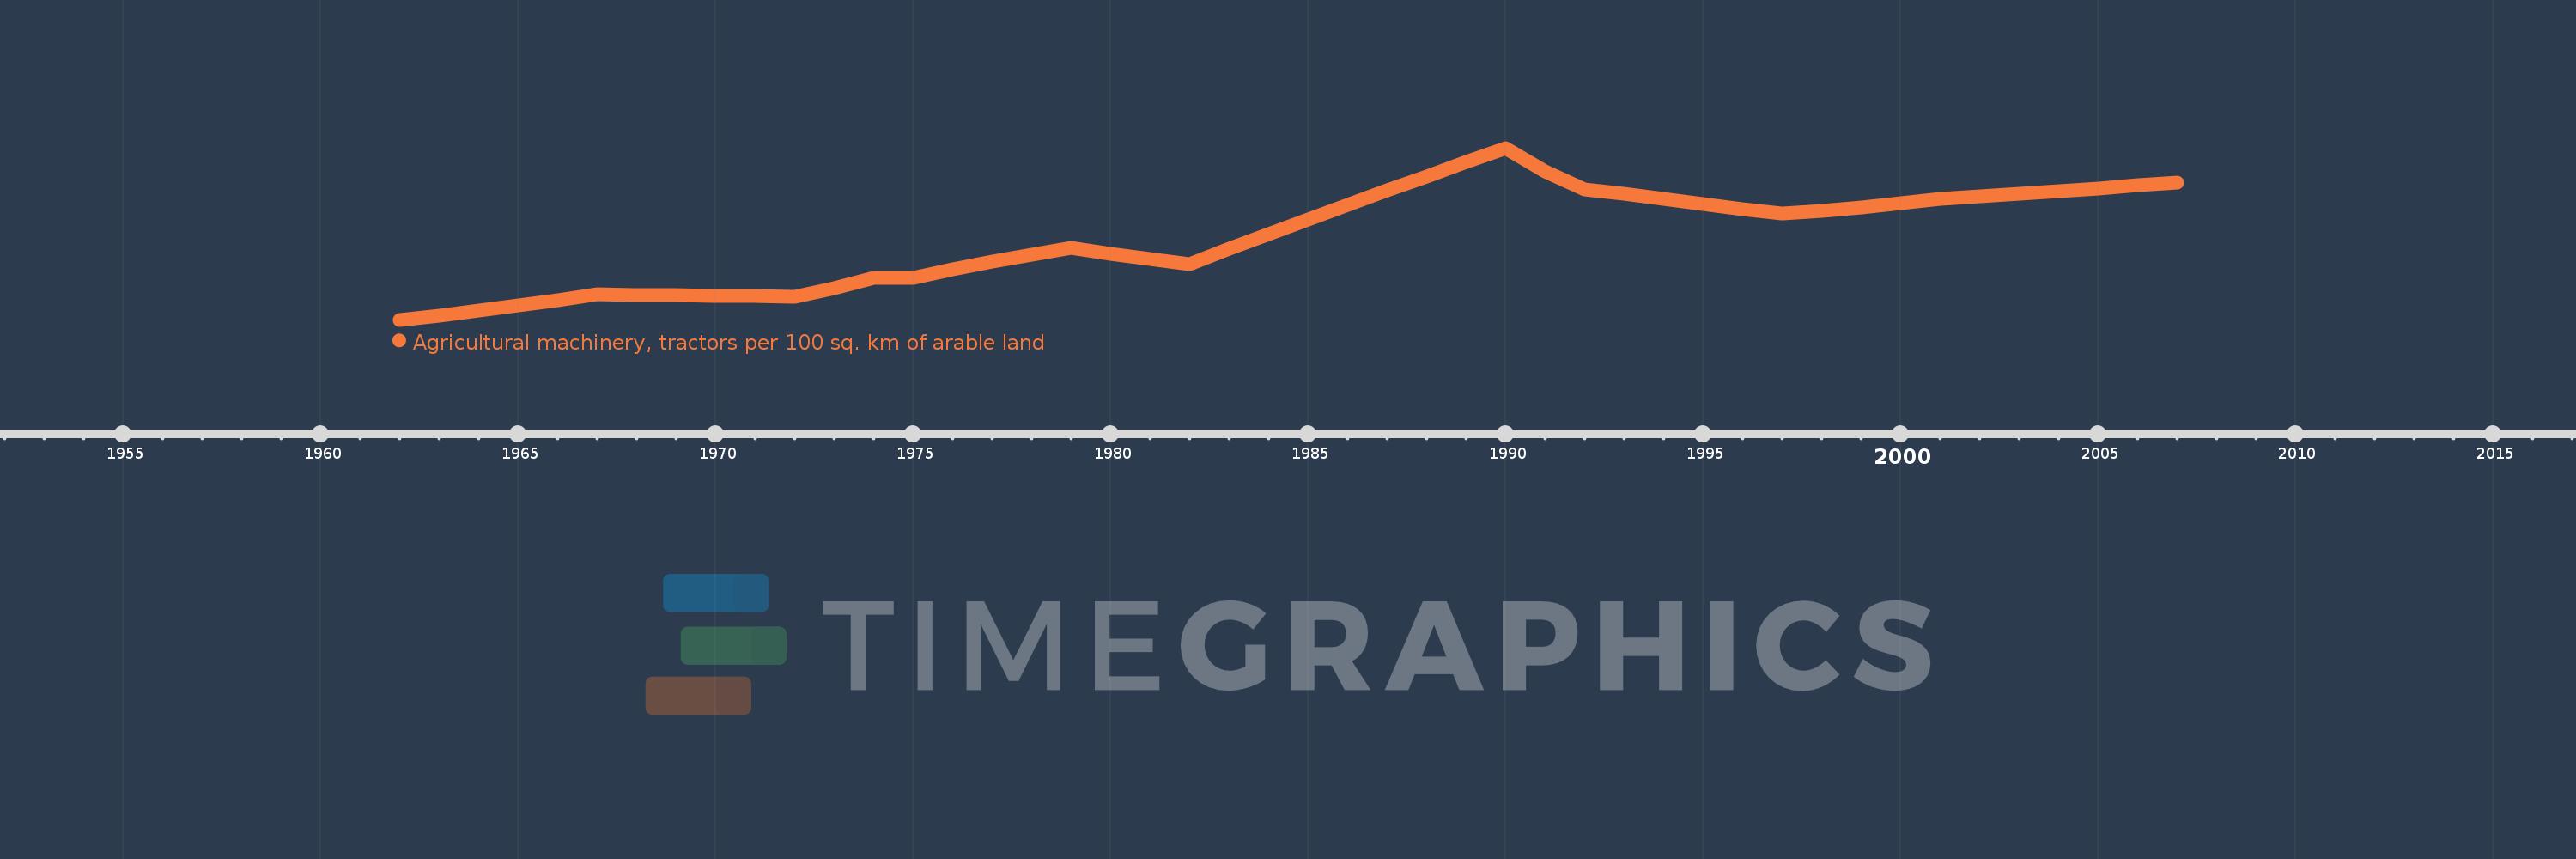
Agricultural machinery, tractors per 100 sq. km of arable land
2007,2006,2005,2004,2003,2002,2001,2000,1999,1998,1997,1996,1995,1994,1993,1992,1991,1990,1989,1988,1987,1986,1985,1984,1983,1982,1981,1980,1979,1978,1977,1976,1975,1974,1973,1972,1971,1970,1969,1968,1967,1966,1965,1964,1963,1962
This statistics in other country:
AfghanistanAlbaniaAlgeriaAmerican SamoaAndorraAngolaAntigua and BarbudaArab WorldArgentinaArmeniaAustraliaAustriaAzerbaijanBahamas, TheBahrainBangladeshBarbadosBelarusBelgiumBelizeBeninBermudaBhutanBoliviaBosnia and HerzegovinaBotswanaBrazilBritish Virgin IslandsBrunei DarussalamBulgariaBurkina FasoBurundiCabo VerdeCambodiaCameroonCanadaCaribbean small statesCentral African RepublicCentral Europe and the BalticsChadChileChinaColombiaCongo, Dem. Rep.Congo, Rep.Costa RicaCote d'IvoireCroatiaCubaCyprusCzech RepublicDenmarkDjiboutiDominicaDominican RepublicEarly-demographic dividendEast Asia & PacificEast Asia & Pacific (excluding high income)East Asia & Pacific (IDA & IBRD countries)EcuadorEgypt, Arab Rep.El SalvadorEritreaEstoniaEuro areaEurope & Central AsiaEurope & Central Asia (excluding high income)Europe & Central Asia (IDA & IBRD countries)European UnionFijiFinlandFragile and conflict affected situationsFranceFrench PolynesiaGambia, TheGeorgiaGermanyGhanaGreeceGrenadaGuamGuatemalaGuineaGuinea-BissauGuyanaHaitiHeavily indebted poor countries (HIPC)High incomeHondurasHungaryIBRD onlyIcelandIDA & IBRD totalIDA blendIDA onlyIDA totalIndiaIndonesiaIran, Islamic Rep.IraqIrelandIsraelItalyJamaicaJapanJordanKazakhstanKenyaKiribatiKorea, Dem. People’s Rep.Korea, Rep.KuwaitKyrgyz RepublicLao PDRLate-demographic dividendLatin America & Caribbean Latin America & Caribbean (excluding high income)Latin America & the Caribbean (IDA & IBRD countries)LatviaLeast developed countries: UN classificationLebanonLesothoLibyaLiechtensteinLithuaniaLow & middle incomeLow incomeLower middle incomeLuxembourgMacedonia, FYRMadagascarMalawiMalaysiaMaliMaltaMauritaniaMauritiusMexicoMiddle East & North AfricaMiddle East & North Africa (excluding high income)Middle East & North Africa (IDA & IBRD countries)Middle incomeMoldovaMongoliaMoroccoMozambiqueMyanmarNepalNetherlandsNew CaledoniaNew ZealandNicaraguaNigerNigeriaNorth AmericaNorthern Mariana IslandsNorwayOECD membersOmanOther small statesPakistanPanamaPapua New GuineaParaguayPeruPhilippinesPolandPortugalPost-demographic dividendPre-demographic dividendPuerto RicoQatarRomaniaRussian FederationRwandaSamoaSao Tome and PrincipeSaudi ArabiaSenegalSerbiaSeychellesSierra LeoneSlovak RepublicSloveniaSmall statesSolomon IslandsSomaliaSouth AfricaSouth AsiaSouth Asia (IDA & IBRD)SpainSri LankaSt. Kitts and NevisSt. LuciaSt. Vincent and the GrenadinesSub-Saharan Africa Sub-Saharan Africa (excluding high income)Sub-Saharan Africa (IDA & IBRD countries)SudanSurinameSwazilandSwedenSwitzerlandSyrian Arab RepublicTajikistanTanzaniaThailandTimor-LesteTogoTongaTrinidad and TobagoTunisiaTurkeyTurkmenistanUgandaUkraineUnited Arab EmiratesUnited KingdomUnited StatesUpper middle incomeUruguayVanuatuVenezuela, RBVietnamVirgin Islands (U.S.)West Bank and GazaWorldYemen, Rep.ZambiaZimbabwe Timeline:
This timeline shows a graph from 1962 to 2007 of Canada. No data until 1961. Number of actual observations by date: 46.
Source name:
World Development Indicators
Source organization:
Food and Agriculture Organization, electronic files and web site.
Categories, topics:
Agriculture & Rural Development
Last updated:
apr 23, 2017
Indicators value changes by year
Minimum:
134.61
jan 1, 1962
Maximum:
169.55
jan 1, 1990
At the date of observation
Value
Absolute change
Change from previous value
jan 1, 1962
134.61
+134.61
0.0%
jan 1, 1963
135.45
+0.84
0.62%
jan 1, 1964
136.516
+1.066
0.79%
jan 1, 1965
137.575
+1.058
0.78%
jan 1, 1966
138.535
+0.961
0.7%
jan 1, 1967
139.885
+1.35
0.97%
jan 1, 1968
139.674
-0.211
-0.15%
jan 1, 1969
139.569
-0.105
-0.08%
jan 1, 1970
139.495
-0.074
-0.05%
jan 1, 1971
139.42
-0.075
-0.05%
jan 1, 1972
139.348
-0.072
-0.05%
jan 1, 1973
141.07
+1.721
1.24%
jan 1, 1974
143.204
+2.135
1.51%
jan 1, 1975
143.195
-0.009
-0.01%
jan 1, 1976
144.807
+1.612
1.13%
jan 1, 1977
146.44
+1.633
1.13%
jan 1, 1978
147.821
+1.381
0.94%
jan 1, 1979
149.21
+1.389
0.94%
jan 1, 1980
148.082
-1.128
-0.76%
jan 1, 1981
146.994
-1.088
-0.74%
jan 1, 1982
145.901
-1.092
-0.74%
jan 1, 1983
148.982
+3.081
2.11%
jan 1, 1984
151.975
+2.993
2.01%
jan 1, 1985
154.96
+2.985
1.96%
jan 1, 1986
157.944
+2.984
1.93%
jan 1, 1987
160.939
+2.996
1.9%
jan 1, 1988
163.819
+2.88
1.79%
jan 1, 1989
166.689
+2.869
1.75%
jan 1, 1990
169.55
+2.861
1.72%
jan 1, 1991
164.821
-4.729
-2.79%
jan 1, 1992
161.104
-3.717
-2.26%
jan 1, 1993
160.221
-0.882
-0.55%
jan 1, 1994
159.155
-1.066
-0.67%
jan 1, 1995
158.085
-1.07
-0.67%
jan 1, 1996
157.015
-1.07
-0.68%
jan 1, 1997
156.238
-0.777
-0.5%
jan 1, 1998
156.802
+0.564
0.36%
jan 1, 1999
157.437
+0.636
0.41%
jan 1, 2000
158.289
+0.852
0.54%
jan 1, 2001
159.136
+0.846
0.53%
jan 1, 2002
159.66
+0.525
0.33%
jan 1, 2003
160.226
+0.566
0.35%
jan 1, 2004
160.793
+0.566
0.35%
jan 1, 2005
161.367
+0.575
0.36%
jan 1, 2006
161.943
+0.575
0.36%
jan 1, 2007
162.525
+0.582
0.36%
Ranking of countries by current statistics by years


Comments: