29
/
en
AIzaSyAYiBZKx7MnpbEhh9jyipgxe19OcubqV5w
April 1, 2024
145319
Guinea
GIN
true
2
1
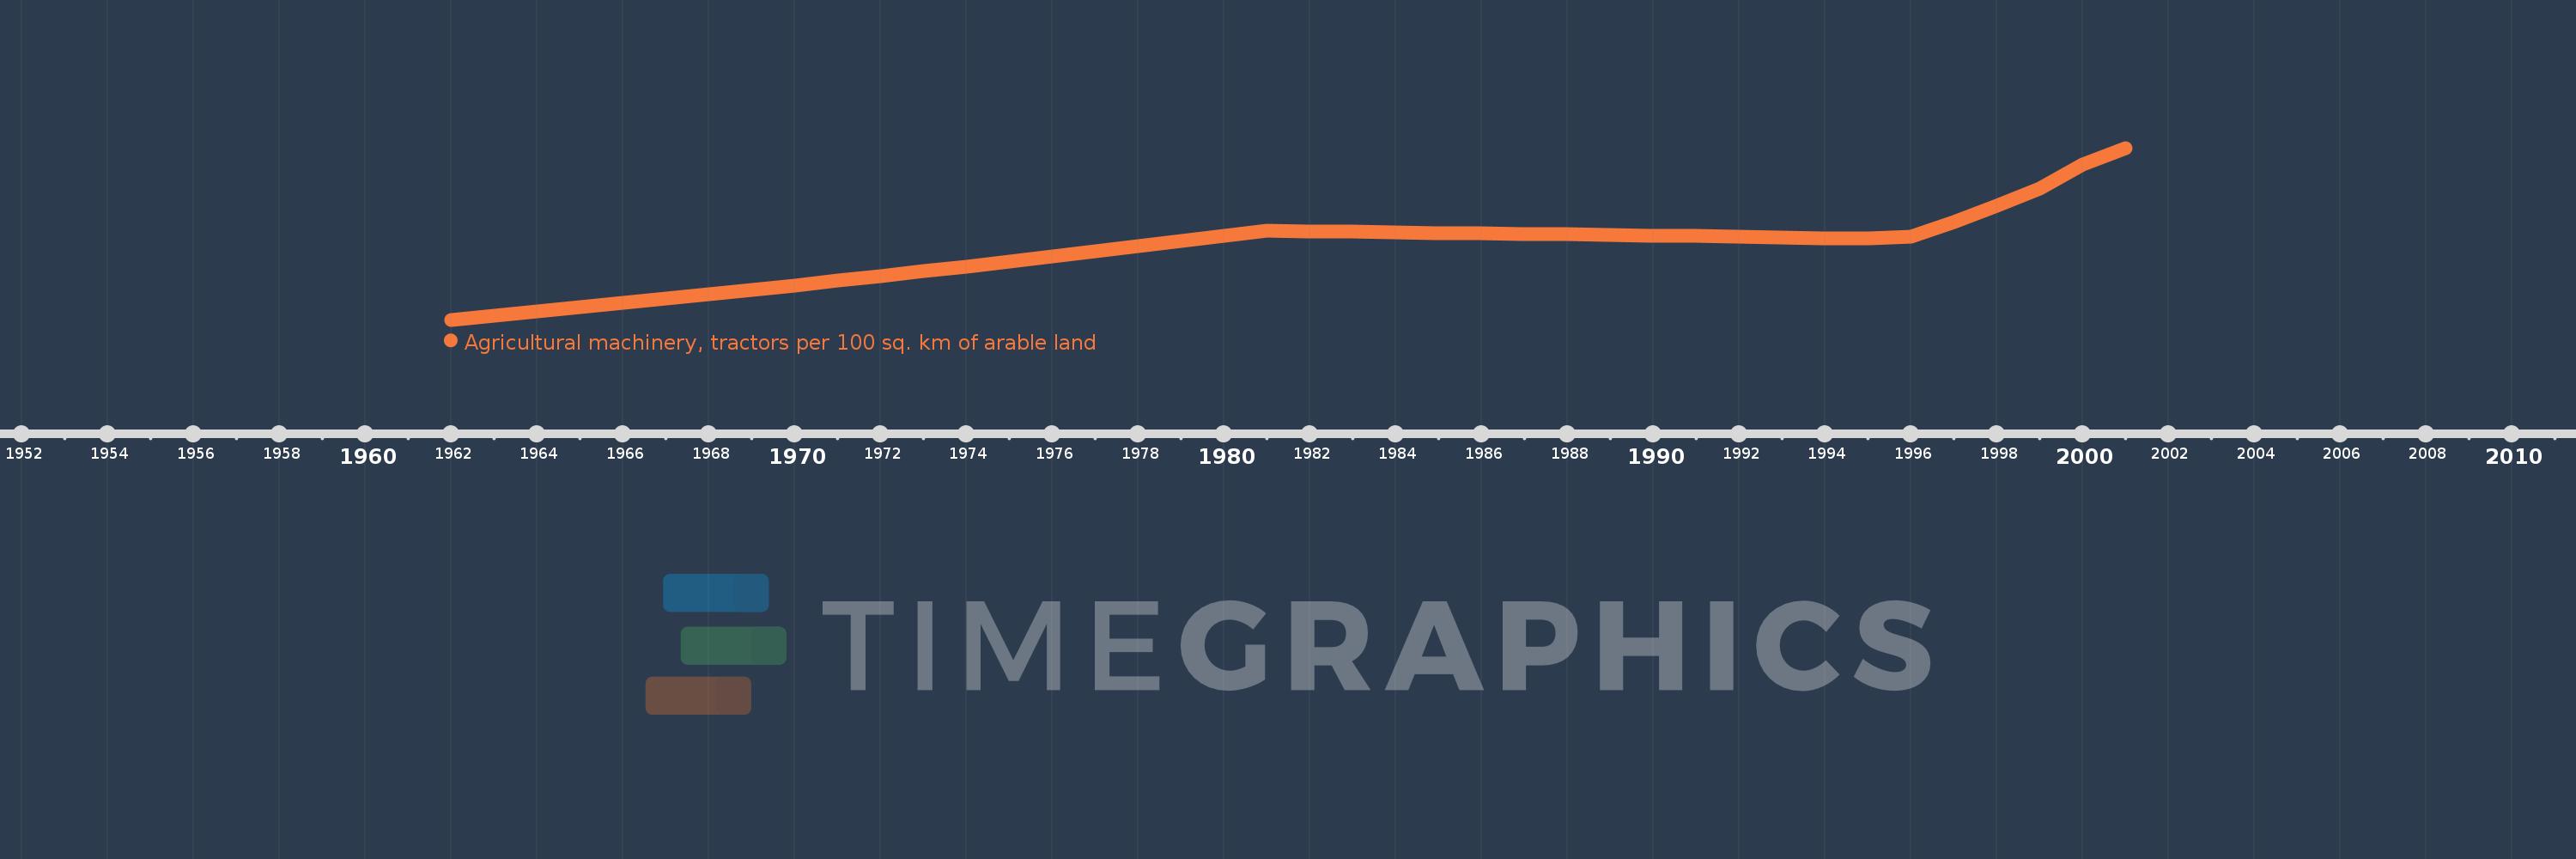
Agricultural machinery, tractors per 100 sq. km of arable land
2001,2000,1999,1998,1997,1996,1995,1994,1993,1992,1991,1990,1989,1988,1987,1986,1985,1984,1983,1982,1981,1980,1979,1978,1977,1976,1975,1974,1973,1972,1971,1970,1969,1968,1967,1966,1965,1964,1963,1962
This statistics in other country:
AfghanistanAlbaniaAlgeriaAmerican SamoaAndorraAngolaAntigua and BarbudaArab WorldArgentinaArmeniaAustraliaAustriaAzerbaijanBahamas, TheBahrainBangladeshBarbadosBelarusBelgiumBelizeBeninBermudaBhutanBoliviaBosnia and HerzegovinaBotswanaBrazilBritish Virgin IslandsBrunei DarussalamBulgariaBurkina FasoBurundiCabo VerdeCambodiaCameroonCanadaCaribbean small statesCentral African RepublicCentral Europe and the BalticsChadChileChinaColombiaCongo, Dem. Rep.Congo, Rep.Costa RicaCote d'IvoireCroatiaCubaCyprusCzech RepublicDenmarkDjiboutiDominicaDominican RepublicEarly-demographic dividendEast Asia & PacificEast Asia & Pacific (excluding high income)East Asia & Pacific (IDA & IBRD countries)EcuadorEgypt, Arab Rep.El SalvadorEritreaEstoniaEuro areaEurope & Central AsiaEurope & Central Asia (excluding high income)Europe & Central Asia (IDA & IBRD countries)European UnionFijiFinlandFragile and conflict affected situationsFranceFrench PolynesiaGambia, TheGeorgiaGermanyGhanaGreeceGrenadaGuamGuatemalaGuineaGuinea-BissauGuyanaHaitiHeavily indebted poor countries (HIPC)High incomeHondurasHungaryIBRD onlyIcelandIDA & IBRD totalIDA blendIDA onlyIDA totalIndiaIndonesiaIran, Islamic Rep.IraqIrelandIsraelItalyJamaicaJapanJordanKazakhstanKenyaKiribatiKorea, Dem. People’s Rep.Korea, Rep.KuwaitKyrgyz RepublicLao PDRLate-demographic dividendLatin America & Caribbean Latin America & Caribbean (excluding high income)Latin America & the Caribbean (IDA & IBRD countries)LatviaLeast developed countries: UN classificationLebanonLesothoLibyaLiechtensteinLithuaniaLow & middle incomeLow incomeLower middle incomeLuxembourgMacedonia, FYRMadagascarMalawiMalaysiaMaliMaltaMauritaniaMauritiusMexicoMiddle East & North AfricaMiddle East & North Africa (excluding high income)Middle East & North Africa (IDA & IBRD countries)Middle incomeMoldovaMongoliaMoroccoMozambiqueMyanmarNepalNetherlandsNew CaledoniaNew ZealandNicaraguaNigerNigeriaNorth AmericaNorthern Mariana IslandsNorwayOECD membersOmanOther small statesPakistanPanamaPapua New GuineaParaguayPeruPhilippinesPolandPortugalPost-demographic dividendPre-demographic dividendPuerto RicoQatarRomaniaRussian FederationRwandaSamoaSao Tome and PrincipeSaudi ArabiaSenegalSerbiaSeychellesSierra LeoneSlovak RepublicSloveniaSmall statesSolomon IslandsSomaliaSouth AfricaSouth AsiaSouth Asia (IDA & IBRD)SpainSri LankaSt. Kitts and NevisSt. LuciaSt. Vincent and the GrenadinesSub-Saharan Africa Sub-Saharan Africa (excluding high income)Sub-Saharan Africa (IDA & IBRD countries)SudanSurinameSwazilandSwedenSwitzerlandSyrian Arab RepublicTajikistanTanzaniaThailandTimor-LesteTogoTongaTrinidad and TobagoTunisiaTurkeyTurkmenistanUgandaUkraineUnited Arab EmiratesUnited KingdomUnited StatesUpper middle incomeUruguayVanuatuVenezuela, RBVietnamVirgin Islands (U.S.)West Bank and GazaWorldYemen, Rep.ZambiaZimbabwe Timeline:
This timeline shows a graph from 1962 to 2001 of Guinea. No data until 1961. Number of actual observations by date: 40.
Source name:
World Development Indicators
Source organization:
Food and Agriculture Organization, electronic files and web site.
Categories, topics:
Agriculture & Rural Development
Last updated:
apr 23, 2017
Indicators value changes by year
Maximum:
25.072
jan 1, 2001
At the date of observation
Value
Absolute change
Change from previous value
jan 1, 1962
1.082
+1.082
0.0%
jan 1, 1963
1.651
+0.569
52.54%
jan 1, 1964
2.232
+0.581
35.17%
jan 1, 1965
2.823
+0.592
26.51%
jan 1, 1966
3.422
+0.599
21.21%
jan 1, 1967
4.027
+0.605
17.68%
jan 1, 1968
4.644
+0.617
15.31%
jan 1, 1969
5.267
+0.622
13.4%
jan 1, 1970
5.901
+0.634
12.05%
jan 1, 1971
6.543
+0.642
10.87%
jan 1, 1972
7.192
+0.65
9.93%
jan 1, 1973
7.854
+0.662
9.21%
jan 1, 1974
8.526
+0.672
8.56%
jan 1, 1975
9.202
+0.676
7.93%
jan 1, 1976
9.894
+0.692
7.52%
jan 1, 1977
10.593
+0.699
7.07%
jan 1, 1978
11.306
+0.713
6.73%
jan 1, 1979
12.03
+0.724
6.4%
jan 1, 1980
12.758
+0.728
6.05%
jan 1, 1981
13.504
+0.746
5.85%
jan 1, 1982
13.433
-0.07
-0.52%
jan 1, 1983
13.365
-0.068
-0.51%
jan 1, 1984
13.292
-0.073
-0.54%
jan 1, 1985
13.214
-0.078
-0.59%
jan 1, 1986
13.143
-0.072
-0.54%
jan 1, 1987
13.066
-0.076
-0.58%
jan 1, 1988
12.989
-0.077
-0.59%
jan 1, 1989
12.906
-0.083
-0.64%
jan 1, 1990
12.829
-0.077
-0.59%
jan 1, 1991
12.748
-0.081
-0.63%
jan 1, 1992
12.665
-0.083
-0.65%
jan 1, 1993
12.585
-0.081
-0.64%
jan 1, 1994
12.495
-0.09
-0.72%
jan 1, 1995
12.408
-0.087
-0.7%
jan 1, 1996
12.714
+0.306
2.47%
jan 1, 1997
14.742
+2.028
15.95%
jan 1, 1998
16.964
+2.222
15.07%
jan 1, 1999
19.384
+2.42
14.26%
jan 1, 2000
22.755
+3.371
17.39%
jan 1, 2001
25.072
+2.318
10.19%
Ranking of countries by current statistics by years


Comments: