29
/
en
AIzaSyAYiBZKx7MnpbEhh9jyipgxe19OcubqV5w
April 1, 2024
90748
Brazil
BRA
true
2
1
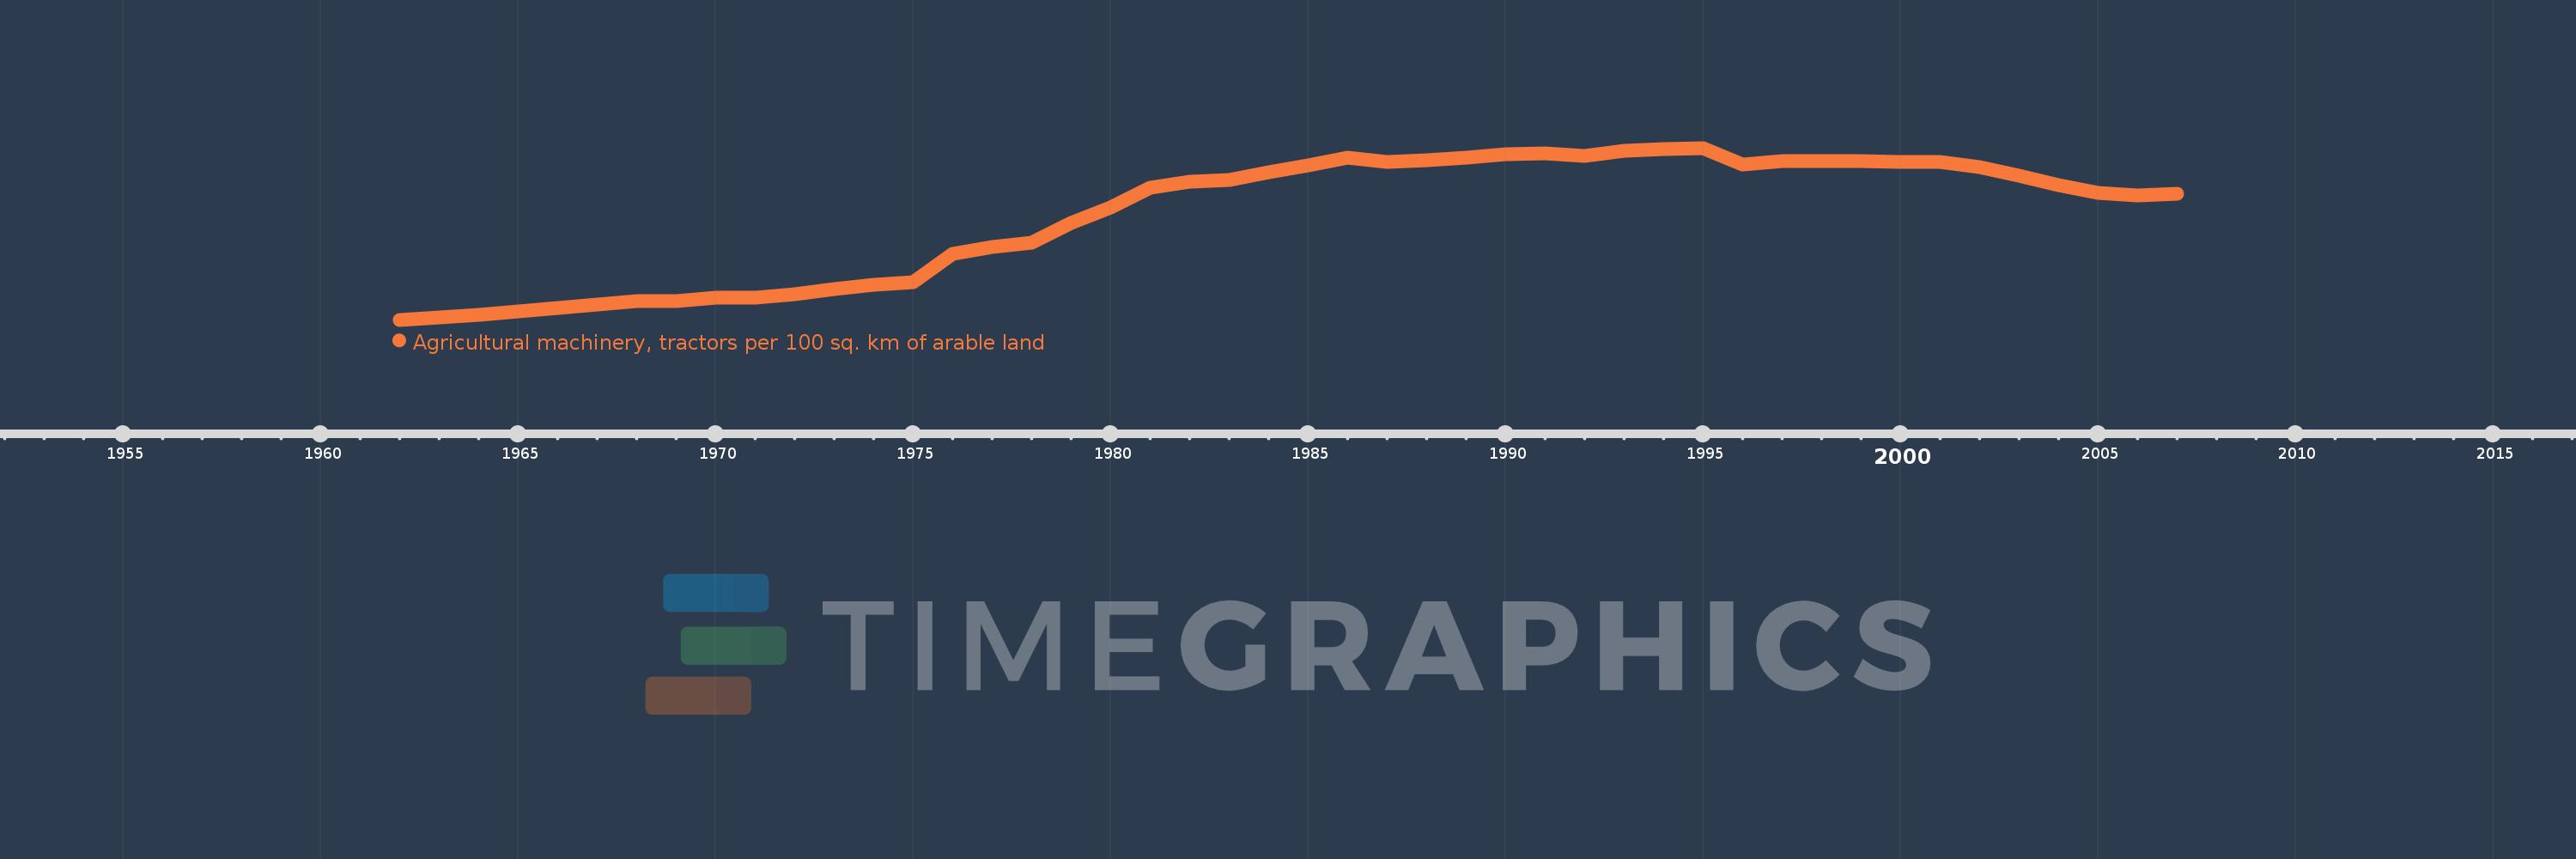
Agricultural machinery, tractors per 100 sq. km of arable land
2007,2006,2005,2004,2003,2002,2001,2000,1999,1998,1997,1996,1995,1994,1993,1992,1991,1990,1989,1988,1987,1986,1985,1984,1983,1982,1981,1980,1979,1978,1977,1976,1975,1974,1973,1972,1971,1970,1969,1968,1967,1966,1965,1964,1963,1962
This statistics in other country:
AfghanistanAlbaniaAlgeriaAmerican SamoaAndorraAngolaAntigua and BarbudaArab WorldArgentinaArmeniaAustraliaAustriaAzerbaijanBahamas, TheBahrainBangladeshBarbadosBelarusBelgiumBelizeBeninBermudaBhutanBoliviaBosnia and HerzegovinaBotswanaBrazilBritish Virgin IslandsBrunei DarussalamBulgariaBurkina FasoBurundiCabo VerdeCambodiaCameroonCanadaCaribbean small statesCentral African RepublicCentral Europe and the BalticsChadChileChinaColombiaCongo, Dem. Rep.Congo, Rep.Costa RicaCote d'IvoireCroatiaCubaCyprusCzech RepublicDenmarkDjiboutiDominicaDominican RepublicEarly-demographic dividendEast Asia & PacificEast Asia & Pacific (excluding high income)East Asia & Pacific (IDA & IBRD countries)EcuadorEgypt, Arab Rep.El SalvadorEritreaEstoniaEuro areaEurope & Central AsiaEurope & Central Asia (excluding high income)Europe & Central Asia (IDA & IBRD countries)European UnionFijiFinlandFragile and conflict affected situationsFranceFrench PolynesiaGambia, TheGeorgiaGermanyGhanaGreeceGrenadaGuamGuatemalaGuineaGuinea-BissauGuyanaHaitiHeavily indebted poor countries (HIPC)High incomeHondurasHungaryIBRD onlyIcelandIDA & IBRD totalIDA blendIDA onlyIDA totalIndiaIndonesiaIran, Islamic Rep.IraqIrelandIsraelItalyJamaicaJapanJordanKazakhstanKenyaKiribatiKorea, Dem. People’s Rep.Korea, Rep.KuwaitKyrgyz RepublicLao PDRLate-demographic dividendLatin America & Caribbean Latin America & Caribbean (excluding high income)Latin America & the Caribbean (IDA & IBRD countries)LatviaLeast developed countries: UN classificationLebanonLesothoLibyaLiechtensteinLithuaniaLow & middle incomeLow incomeLower middle incomeLuxembourgMacedonia, FYRMadagascarMalawiMalaysiaMaliMaltaMauritaniaMauritiusMexicoMiddle East & North AfricaMiddle East & North Africa (excluding high income)Middle East & North Africa (IDA & IBRD countries)Middle incomeMoldovaMongoliaMoroccoMozambiqueMyanmarNepalNetherlandsNew CaledoniaNew ZealandNicaraguaNigerNigeriaNorth AmericaNorthern Mariana IslandsNorwayOECD membersOmanOther small statesPakistanPanamaPapua New GuineaParaguayPeruPhilippinesPolandPortugalPost-demographic dividendPre-demographic dividendPuerto RicoQatarRomaniaRussian FederationRwandaSamoaSao Tome and PrincipeSaudi ArabiaSenegalSerbiaSeychellesSierra LeoneSlovak RepublicSloveniaSmall statesSolomon IslandsSomaliaSouth AfricaSouth AsiaSouth Asia (IDA & IBRD)SpainSri LankaSt. Kitts and NevisSt. LuciaSt. Vincent and the GrenadinesSub-Saharan Africa Sub-Saharan Africa (excluding high income)Sub-Saharan Africa (IDA & IBRD countries)SudanSurinameSwazilandSwedenSwitzerlandSyrian Arab RepublicTajikistanTanzaniaThailandTimor-LesteTogoTongaTrinidad and TobagoTunisiaTurkeyTurkmenistanUgandaUkraineUnited Arab EmiratesUnited KingdomUnited StatesUpper middle incomeUruguayVanuatuVenezuela, RBVietnamVirgin Islands (U.S.)West Bank and GazaWorldYemen, Rep.ZambiaZimbabwe Timeline:
This timeline shows a graph from 1962 to 2007 of Brazil. No data until 1961. Number of actual observations by date: 46.
Source name:
World Development Indicators
Source organization:
Food and Agriculture Organization, electronic files and web site.
Categories, topics:
Agriculture & Rural Development
Last updated:
apr 23, 2017
Indicators value changes by year
Minimum:
32.553
jan 1, 1962
Maximum:
147.645
jan 1, 1995
At the date of observation
Value
Absolute change
Change from previous value
jan 1, 1962
32.553
+32.553
0.0%
jan 1, 1963
34.167
+1.614
4.96%
jan 1, 1964
35.769
+1.603
4.69%
jan 1, 1965
38.148
+2.379
6.65%
jan 1, 1966
40.714
+2.566
6.73%
jan 1, 1967
42.759
+2.044
5.02%
jan 1, 1968
44.833
+2.075
4.85%
jan 1, 1969
45.313
+0.479
1.07%
jan 1, 1970
47.091
+1.778
3.92%
jan 1, 1971
47.391
+0.301
0.64%
jan 1, 1972
49.595
+2.203
4.65%
jan 1, 1973
52.895
+3.3
6.65%
jan 1, 1974
56.026
+3.131
5.92%
jan 1, 1975
57.561
+1.535
2.74%
jan 1, 1976
76.932
+19.371
33.65%
jan 1, 1977
81.395
+4.464
5.8%
jan 1, 1978
84.091
+2.696
3.31%
jan 1, 1979
97.273
+13.182
15.68%
jan 1, 1980
108.018
+10.745
11.05%
jan 1, 1981
121.157
+13.139
12.16%
jan 1, 1982
124.781
+3.624
2.99%
jan 1, 1983
126.17
+1.39
1.11%
jan 1, 1984
131.277
+5.106
4.05%
jan 1, 1985
136.093
+4.817
3.67%
jan 1, 1986
140.869
+4.775
3.51%
jan 1, 1987
138.531
-2.337
-1.66%
jan 1, 1988
139.656
+1.125
0.81%
jan 1, 1989
141.323
+1.667
1.19%
jan 1, 1990
143.544
+2.221
1.57%
jan 1, 1991
143.797
+0.253
0.18%
jan 1, 1992
142.558
-1.239
-0.86%
jan 1, 1993
145.506
+2.948
2.07%
jan 1, 1994
146.613
+1.107
0.76%
jan 1, 1995
147.645
+1.032
0.7%
jan 1, 1996
136.283
-11.362
-7.7%
jan 1, 1997
138.916
+2.633
1.93%
jan 1, 1998
138.813
-0.103
-0.07%
jan 1, 1999
138.712
-0.102
-0.07%
jan 1, 2000
138.369
-0.343
-0.25%
jan 1, 2001
138.026
-0.342
-0.25%
jan 1, 2002
134.736
-3.29
-2.38%
jan 1, 2003
129.151
-5.585
-4.15%
jan 1, 2004
122.639
-6.512
-5.04%
jan 1, 2005
117.726
-4.912
-4.01%
jan 1, 2006
116.081
-1.645
-1.4%
jan 1, 2007
116.862
+0.781
0.67%
Ranking of countries by current statistics by years


Comments: