29
/
en
AIzaSyAYiBZKx7MnpbEhh9jyipgxe19OcubqV5w
April 1, 2024
152224
Hungary
HUN
true
2
1
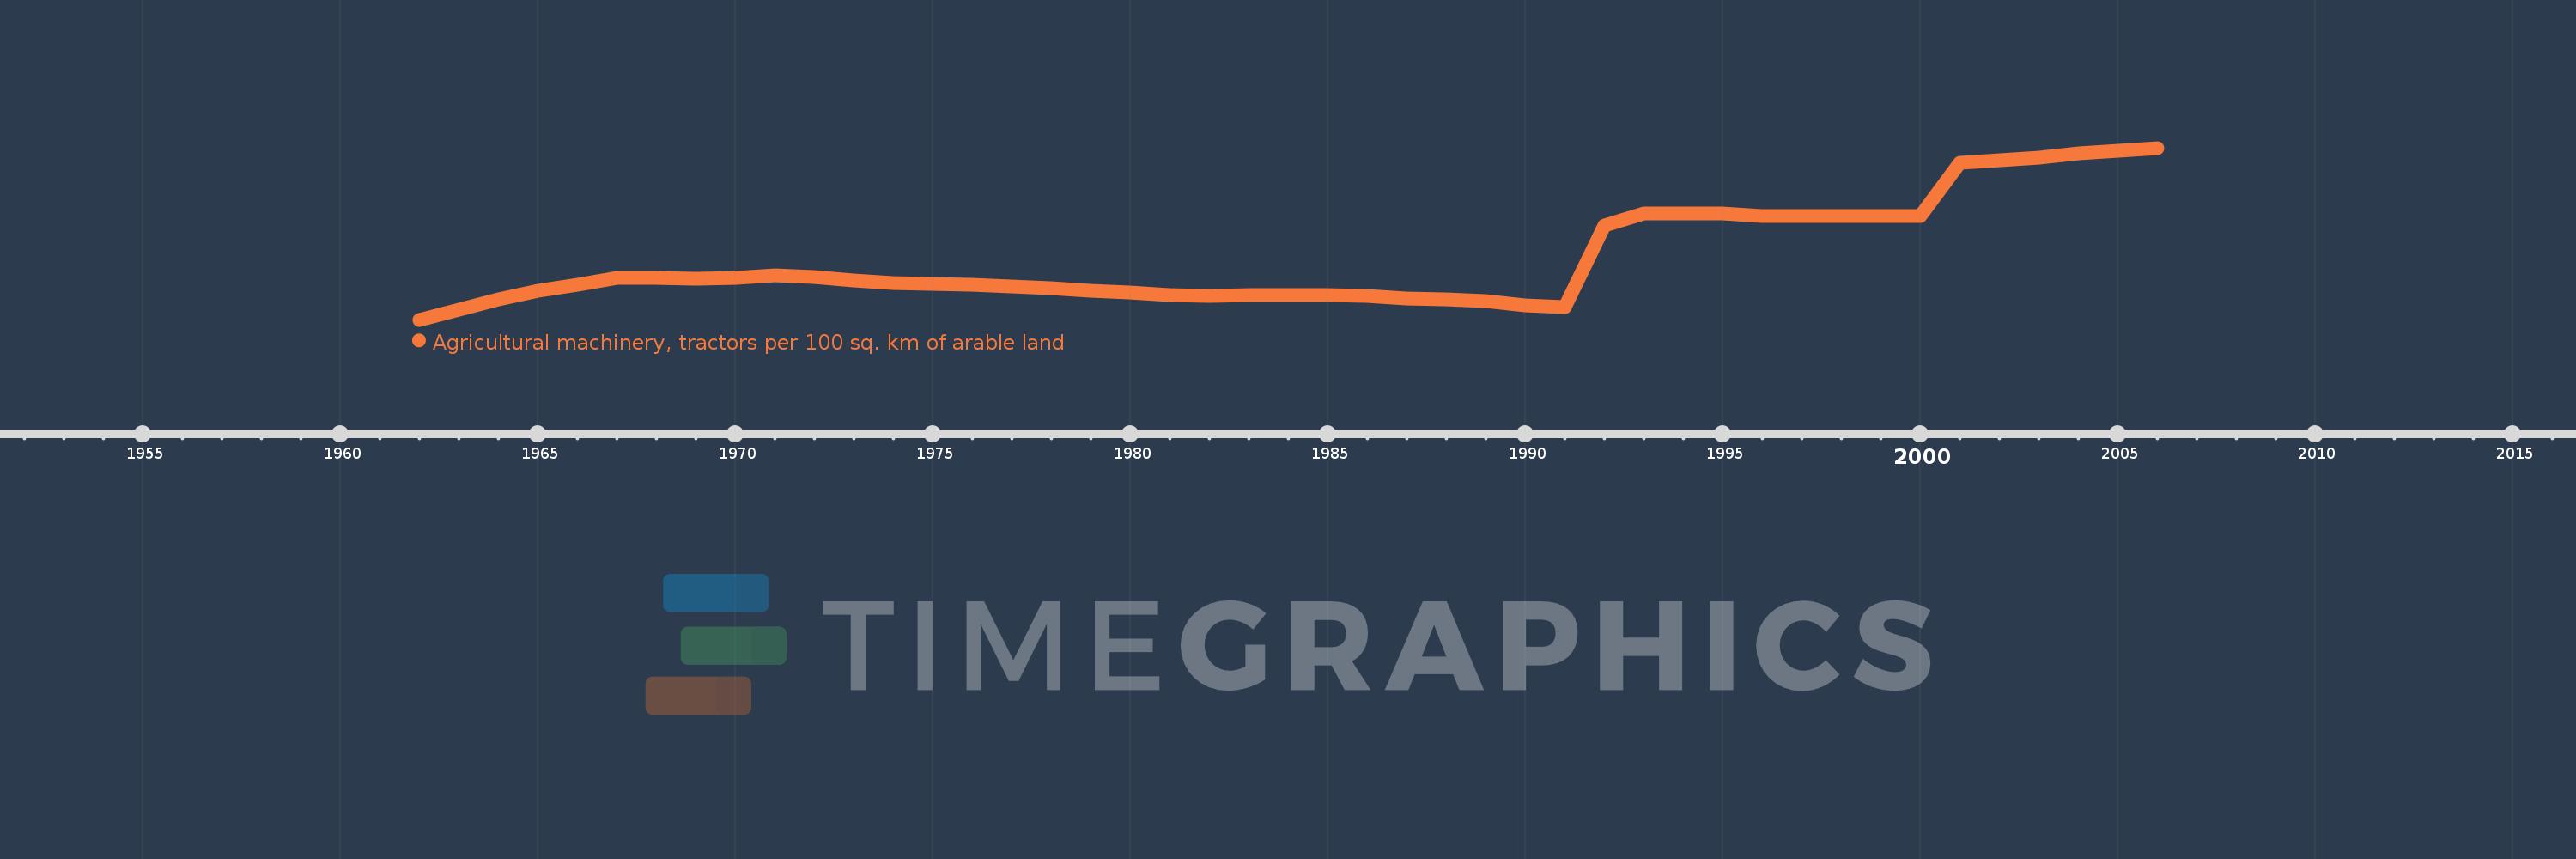
Agricultural machinery, tractors per 100 sq. km of arable land
2006,2005,2004,2003,2002,2001,2000,1999,1998,1997,1996,1995,1994,1993,1992,1991,1990,1989,1988,1987,1986,1985,1984,1983,1982,1981,1980,1979,1978,1977,1976,1975,1974,1973,1972,1971,1970,1969,1968,1967,1966,1965,1964,1963,1962
This statistics in other country:
AfghanistanAlbaniaAlgeriaAmerican SamoaAndorraAngolaAntigua and BarbudaArab WorldArgentinaArmeniaAustraliaAustriaAzerbaijanBahamas, TheBahrainBangladeshBarbadosBelarusBelgiumBelizeBeninBermudaBhutanBoliviaBosnia and HerzegovinaBotswanaBrazilBritish Virgin IslandsBrunei DarussalamBulgariaBurkina FasoBurundiCabo VerdeCambodiaCameroonCanadaCaribbean small statesCentral African RepublicCentral Europe and the BalticsChadChileChinaColombiaCongo, Dem. Rep.Congo, Rep.Costa RicaCote d'IvoireCroatiaCubaCyprusCzech RepublicDenmarkDjiboutiDominicaDominican RepublicEarly-demographic dividendEast Asia & PacificEast Asia & Pacific (excluding high income)East Asia & Pacific (IDA & IBRD countries)EcuadorEgypt, Arab Rep.El SalvadorEritreaEstoniaEuro areaEurope & Central AsiaEurope & Central Asia (excluding high income)Europe & Central Asia (IDA & IBRD countries)European UnionFijiFinlandFragile and conflict affected situationsFranceFrench PolynesiaGambia, TheGeorgiaGermanyGhanaGreeceGrenadaGuamGuatemalaGuineaGuinea-BissauGuyanaHaitiHeavily indebted poor countries (HIPC)High incomeHondurasHungaryIBRD onlyIcelandIDA & IBRD totalIDA blendIDA onlyIDA totalIndiaIndonesiaIran, Islamic Rep.IraqIrelandIsraelItalyJamaicaJapanJordanKazakhstanKenyaKiribatiKorea, Dem. People’s Rep.Korea, Rep.KuwaitKyrgyz RepublicLao PDRLate-demographic dividendLatin America & Caribbean Latin America & Caribbean (excluding high income)Latin America & the Caribbean (IDA & IBRD countries)LatviaLeast developed countries: UN classificationLebanonLesothoLibyaLiechtensteinLithuaniaLow & middle incomeLow incomeLower middle incomeLuxembourgMacedonia, FYRMadagascarMalawiMalaysiaMaliMaltaMauritaniaMauritiusMexicoMiddle East & North AfricaMiddle East & North Africa (excluding high income)Middle East & North Africa (IDA & IBRD countries)Middle incomeMoldovaMongoliaMoroccoMozambiqueMyanmarNepalNetherlandsNew CaledoniaNew ZealandNicaraguaNigerNigeriaNorth AmericaNorthern Mariana IslandsNorwayOECD membersOmanOther small statesPakistanPanamaPapua New GuineaParaguayPeruPhilippinesPolandPortugalPost-demographic dividendPre-demographic dividendPuerto RicoQatarRomaniaRussian FederationRwandaSamoaSao Tome and PrincipeSaudi ArabiaSenegalSerbiaSeychellesSierra LeoneSlovak RepublicSloveniaSmall statesSolomon IslandsSomaliaSouth AfricaSouth AsiaSouth Asia (IDA & IBRD)SpainSri LankaSt. Kitts and NevisSt. LuciaSt. Vincent and the GrenadinesSub-Saharan Africa Sub-Saharan Africa (excluding high income)Sub-Saharan Africa (IDA & IBRD countries)SudanSurinameSwazilandSwedenSwitzerlandSyrian Arab RepublicTajikistanTanzaniaThailandTimor-LesteTogoTongaTrinidad and TobagoTunisiaTurkeyTurkmenistanUgandaUkraineUnited Arab EmiratesUnited KingdomUnited StatesUpper middle incomeUruguayVanuatuVenezuela, RBVietnamVirgin Islands (U.S.)West Bank and GazaWorldYemen, Rep.ZambiaZimbabwe Timeline:
This timeline shows a graph from 1962 to 2006 of Hungary. No data until 1961. Number of actual observations by date: 45.
Source name:
World Development Indicators
Source organization:
Food and Agriculture Organization, electronic files and web site.
Categories, topics:
Agriculture & Rural Development
Last updated:
apr 23, 2017
Indicators value changes by year
Minimum:
85.035
jan 1, 1962
Maximum:
261.85
jan 1, 2006
At the date of observation
Value
Absolute change
Change from previous value
jan 1, 1962
85.035
+85.035
0.0%
jan 1, 1963
95.154
+10.119
11.9%
jan 1, 1964
105.665
+10.511
11.05%
jan 1, 1965
115.041
+9.376
8.87%
jan 1, 1966
121.45
+6.408
5.57%
jan 1, 1967
127.837
+6.388
5.26%
jan 1, 1968
128.199
+0.362
0.28%
jan 1, 1969
127.621
-0.579
-0.45%
jan 1, 1970
128.088
+0.468
0.37%
jan 1, 1971
130.842
+2.753
2.15%
jan 1, 1972
129.315
-1.526
-1.17%
jan 1, 1973
125.295
-4.021
-3.11%
jan 1, 1974
122.734
-2.561
-2.04%
jan 1, 1975
121.585
-1.149
-0.94%
jan 1, 1976
121.174
-0.411
-0.34%
jan 1, 1977
119.426
-1.748
-1.44%
jan 1, 1978
117.868
-1.558
-1.3%
jan 1, 1979
114.897
-2.971
-2.52%
jan 1, 1980
113.276
-1.621
-1.41%
jan 1, 1981
110.308
-2.967
-2.62%
jan 1, 1982
109.147
-1.161
-1.05%
jan 1, 1983
110.251
+1.104
1.01%
jan 1, 1984
110.779
+0.528
0.48%
jan 1, 1985
110.233
-0.546
-0.49%
jan 1, 1986
109.843
-0.39
-0.35%
jan 1, 1987
106.974
-2.869
-2.61%
jan 1, 1988
105.996
-0.978
-0.91%
jan 1, 1989
104.485
-1.511
-1.43%
jan 1, 1990
99.739
-4.746
-4.54%
jan 1, 1991
97.744
-1.994
-2.0%
jan 1, 1992
181.79
+84.046
85.99%
jan 1, 1993
194.011
+12.221
6.72%
jan 1, 1994
193.976
-0.035
-0.02%
jan 1, 1995
194.041
+0.064
0.03%
jan 1, 1996
191.844
-2.197
-1.13%
jan 1, 1997
191.675
-0.168
-0.09%
jan 1, 1998
191.39
-0.285
-0.15%
jan 1, 1999
191.471
+0.081
0.04%
jan 1, 2000
191.693
+0.221
0.12%
jan 1, 2001
246.21
+54.518
28.44%
jan 1, 2002
249.11
+2.9
1.18%
jan 1, 2003
252.225
+3.116
1.25%
jan 1, 2004
255.841
+3.615
1.43%
jan 1, 2005
258.904
+3.063
1.2%
jan 1, 2006
261.85
+2.946
1.14%
Ranking of countries by current statistics by years


Comments: