29
/
en
AIzaSyAYiBZKx7MnpbEhh9jyipgxe19OcubqV5w
April 1, 2024
43186
Latin America & the Caribbean (IDA & IBRD countries)
TLA
false
2
1
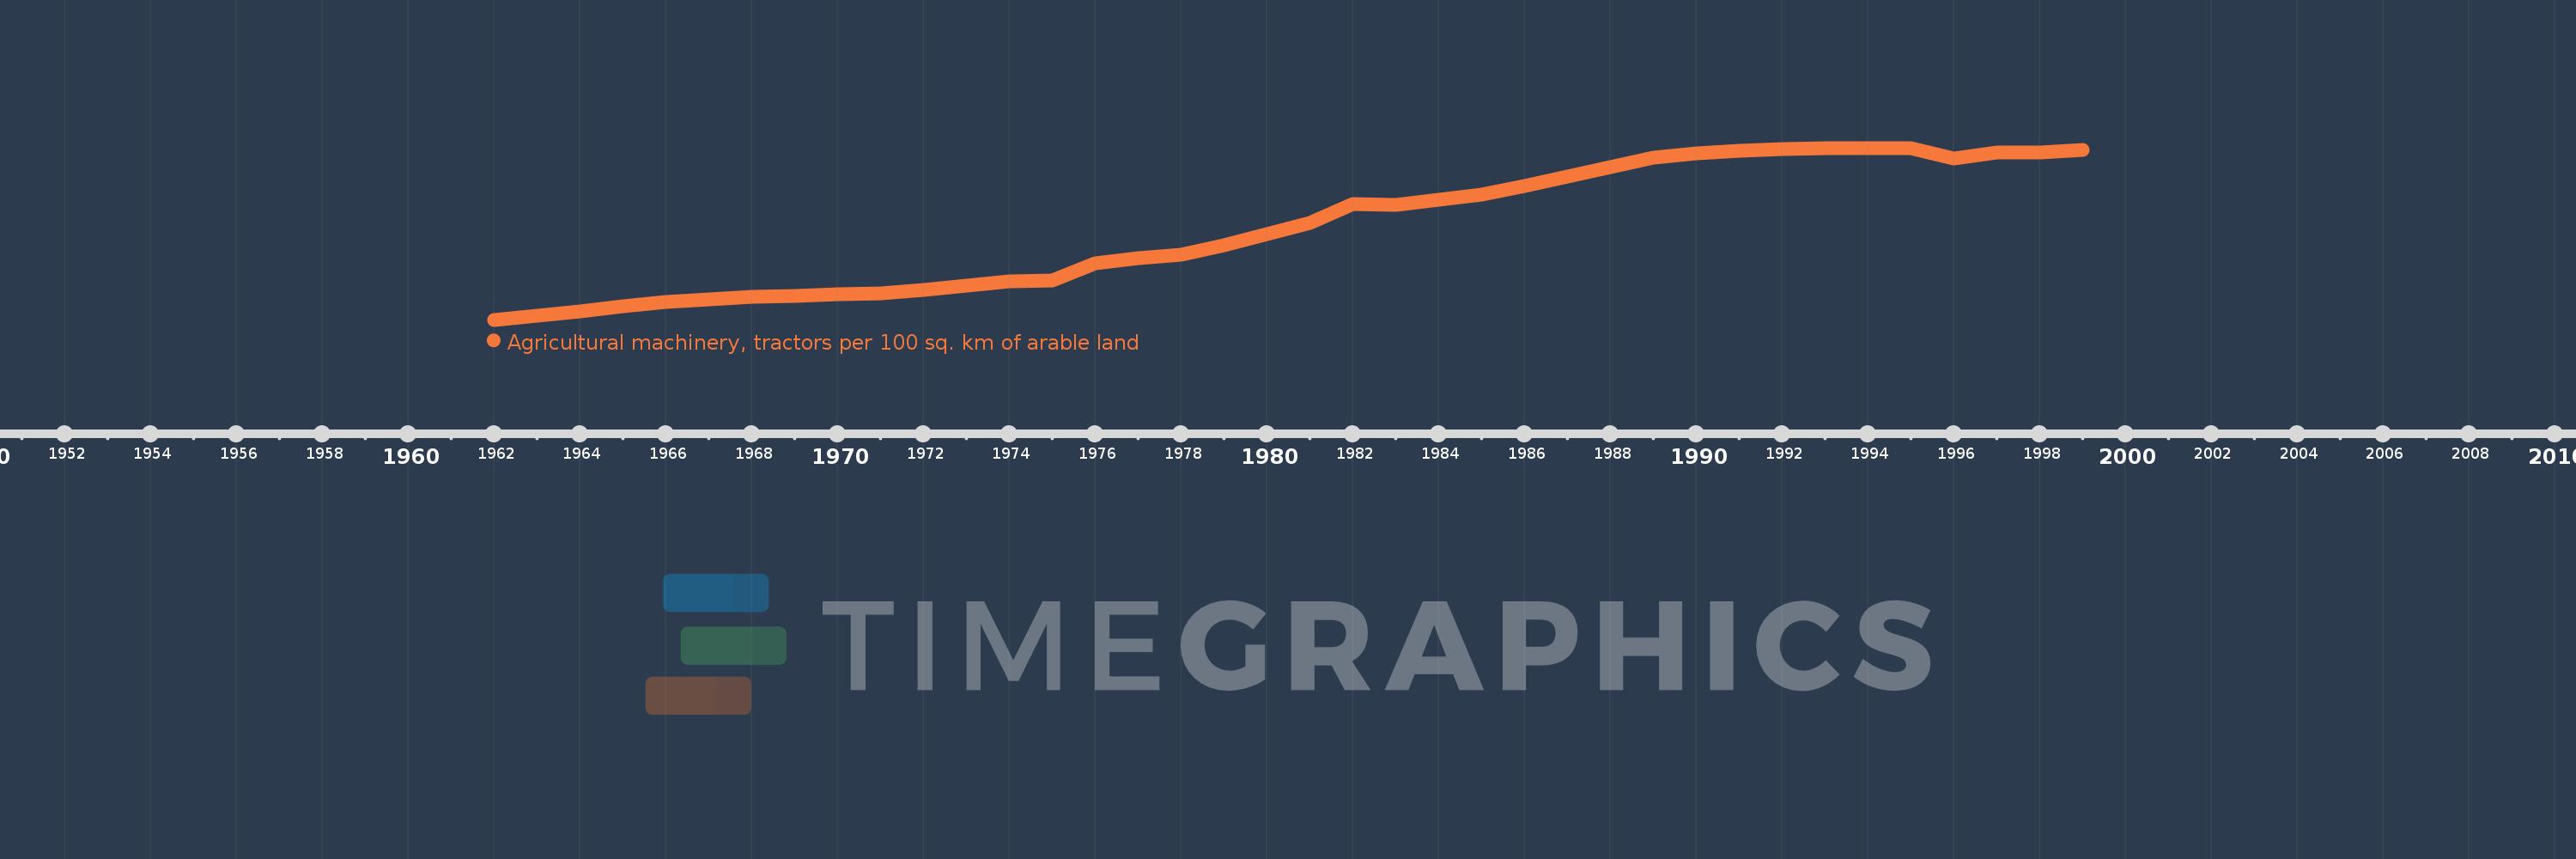
Agricultural machinery, tractors per 100 sq. km of arable land
1999,1998,1997,1996,1995,1994,1993,1992,1991,1990,1989,1988,1987,1986,1985,1984,1983,1982,1981,1980,1979,1978,1977,1976,1975,1974,1973,1972,1971,1970,1969,1968,1967,1966,1965,1964,1963,1962
This statistics in other country:
AfghanistanAlbaniaAlgeriaAmerican SamoaAndorraAngolaAntigua and BarbudaArab WorldArgentinaArmeniaAustraliaAustriaAzerbaijanBahamas, TheBahrainBangladeshBarbadosBelarusBelgiumBelizeBeninBermudaBhutanBoliviaBosnia and HerzegovinaBotswanaBrazilBritish Virgin IslandsBrunei DarussalamBulgariaBurkina FasoBurundiCabo VerdeCambodiaCameroonCanadaCaribbean small statesCentral African RepublicCentral Europe and the BalticsChadChileChinaColombiaCongo, Dem. Rep.Congo, Rep.Costa RicaCote d'IvoireCroatiaCubaCyprusCzech RepublicDenmarkDjiboutiDominicaDominican RepublicEarly-demographic dividendEast Asia & PacificEast Asia & Pacific (excluding high income)East Asia & Pacific (IDA & IBRD countries)EcuadorEgypt, Arab Rep.El SalvadorEritreaEstoniaEuro areaEurope & Central AsiaEurope & Central Asia (excluding high income)Europe & Central Asia (IDA & IBRD countries)European UnionFijiFinlandFragile and conflict affected situationsFranceFrench PolynesiaGambia, TheGeorgiaGermanyGhanaGreeceGrenadaGuamGuatemalaGuineaGuinea-BissauGuyanaHaitiHeavily indebted poor countries (HIPC)High incomeHondurasHungaryIBRD onlyIcelandIDA & IBRD totalIDA blendIDA onlyIDA totalIndiaIndonesiaIran, Islamic Rep.IraqIrelandIsraelItalyJamaicaJapanJordanKazakhstanKenyaKiribatiKorea, Dem. People’s Rep.Korea, Rep.KuwaitKyrgyz RepublicLao PDRLate-demographic dividendLatin America & Caribbean Latin America & Caribbean (excluding high income)Latin America & the Caribbean (IDA & IBRD countries)LatviaLeast developed countries: UN classificationLebanonLesothoLibyaLiechtensteinLithuaniaLow & middle incomeLow incomeLower middle incomeLuxembourgMacedonia, FYRMadagascarMalawiMalaysiaMaliMaltaMauritaniaMauritiusMexicoMiddle East & North AfricaMiddle East & North Africa (excluding high income)Middle East & North Africa (IDA & IBRD countries)Middle incomeMoldovaMongoliaMoroccoMozambiqueMyanmarNepalNetherlandsNew CaledoniaNew ZealandNicaraguaNigerNigeriaNorth AmericaNorthern Mariana IslandsNorwayOECD membersOmanOther small statesPakistanPanamaPapua New GuineaParaguayPeruPhilippinesPolandPortugalPost-demographic dividendPre-demographic dividendPuerto RicoQatarRomaniaRussian FederationRwandaSamoaSao Tome and PrincipeSaudi ArabiaSenegalSerbiaSeychellesSierra LeoneSlovak RepublicSloveniaSmall statesSolomon IslandsSomaliaSouth AfricaSouth AsiaSouth Asia (IDA & IBRD)SpainSri LankaSt. Kitts and NevisSt. LuciaSt. Vincent and the GrenadinesSub-Saharan Africa Sub-Saharan Africa (excluding high income)Sub-Saharan Africa (IDA & IBRD countries)SudanSurinameSwazilandSwedenSwitzerlandSyrian Arab RepublicTajikistanTanzaniaThailandTimor-LesteTogoTongaTrinidad and TobagoTunisiaTurkeyTurkmenistanUgandaUkraineUnited Arab EmiratesUnited KingdomUnited StatesUpper middle incomeUruguayVanuatuVenezuela, RBVietnamVirgin Islands (U.S.)West Bank and GazaWorldYemen, Rep.ZambiaZimbabwe Timeline:
This timeline shows a graph from 1962 to 1999 of Latin America & the Caribbean (IDA & IBRD countries). No data until 1961. Number of actual observations by date: 38.
Source name:
World Development Indicators
Source organization:
Food and Agriculture Organization, electronic files and web site.
Categories, topics:
Agriculture & Rural Development
Last updated:
apr 23, 2017
Indicators value changes by year
Minimum:
43.132
jan 1, 1962
Maximum:
121.849
jan 1, 1993
At the date of observation
Value
Absolute change
Change from previous value
jan 1, 1962
43.132
+43.132
0.0%
jan 1, 1963
45.121
+1.989
4.61%
jan 1, 1964
46.976
+1.854
4.11%
jan 1, 1965
49.319
+2.344
4.99%
jan 1, 1966
51.253
+1.934
3.92%
jan 1, 1967
52.575
+1.322
2.58%
jan 1, 1968
53.723
+1.148
2.18%
jan 1, 1969
54.172
+0.449
0.84%
jan 1, 1970
54.847
+0.675
1.25%
jan 1, 1971
55.383
+0.536
0.98%
jan 1, 1972
56.925
+1.542
2.78%
jan 1, 1973
58.679
+1.754
3.08%
jan 1, 1974
60.845
+2.166
3.69%
jan 1, 1975
61.052
+0.207
0.34%
jan 1, 1976
69.098
+8.046
13.18%
jan 1, 1977
71.23
+2.132
3.09%
jan 1, 1978
72.803
+1.573
2.21%
jan 1, 1979
77.11
+4.307
5.92%
jan 1, 1980
82.409
+5.299
6.87%
jan 1, 1981
87.496
+5.087
6.17%
jan 1, 1982
96.048
+8.552
9.77%
jan 1, 1983
95.781
-0.267
-0.28%
jan 1, 1984
97.978
+2.197
2.29%
jan 1, 1985
100.575
+2.597
2.65%
jan 1, 1986
104.527
+3.952
3.93%
jan 1, 1987
108.649
+4.123
3.94%
jan 1, 1988
112.92
+4.27
3.93%
jan 1, 1989
117.506
+4.586
4.06%
jan 1, 1990
119.203
+1.697
1.44%
jan 1, 1991
120.666
+1.463
1.23%
jan 1, 1992
121.213
+0.547
0.45%
jan 1, 1993
121.849
+0.636
0.52%
jan 1, 1994
121.832
-0.018
-0.01%
jan 1, 1995
121.785
-0.047
-0.04%
jan 1, 1996
117.044
-4.741
-3.89%
jan 1, 1997
119.861
+2.817
2.41%
jan 1, 1998
119.697
-0.165
-0.14%
jan 1, 1999
120.991
+1.294
1.08%
Ranking of countries by current statistics by years


Comments: