29
/
en
AIzaSyAYiBZKx7MnpbEhh9jyipgxe19OcubqV5w
April 1, 2024
48712
Middle East & North Africa (excluding high income)
MNA
false
2
1
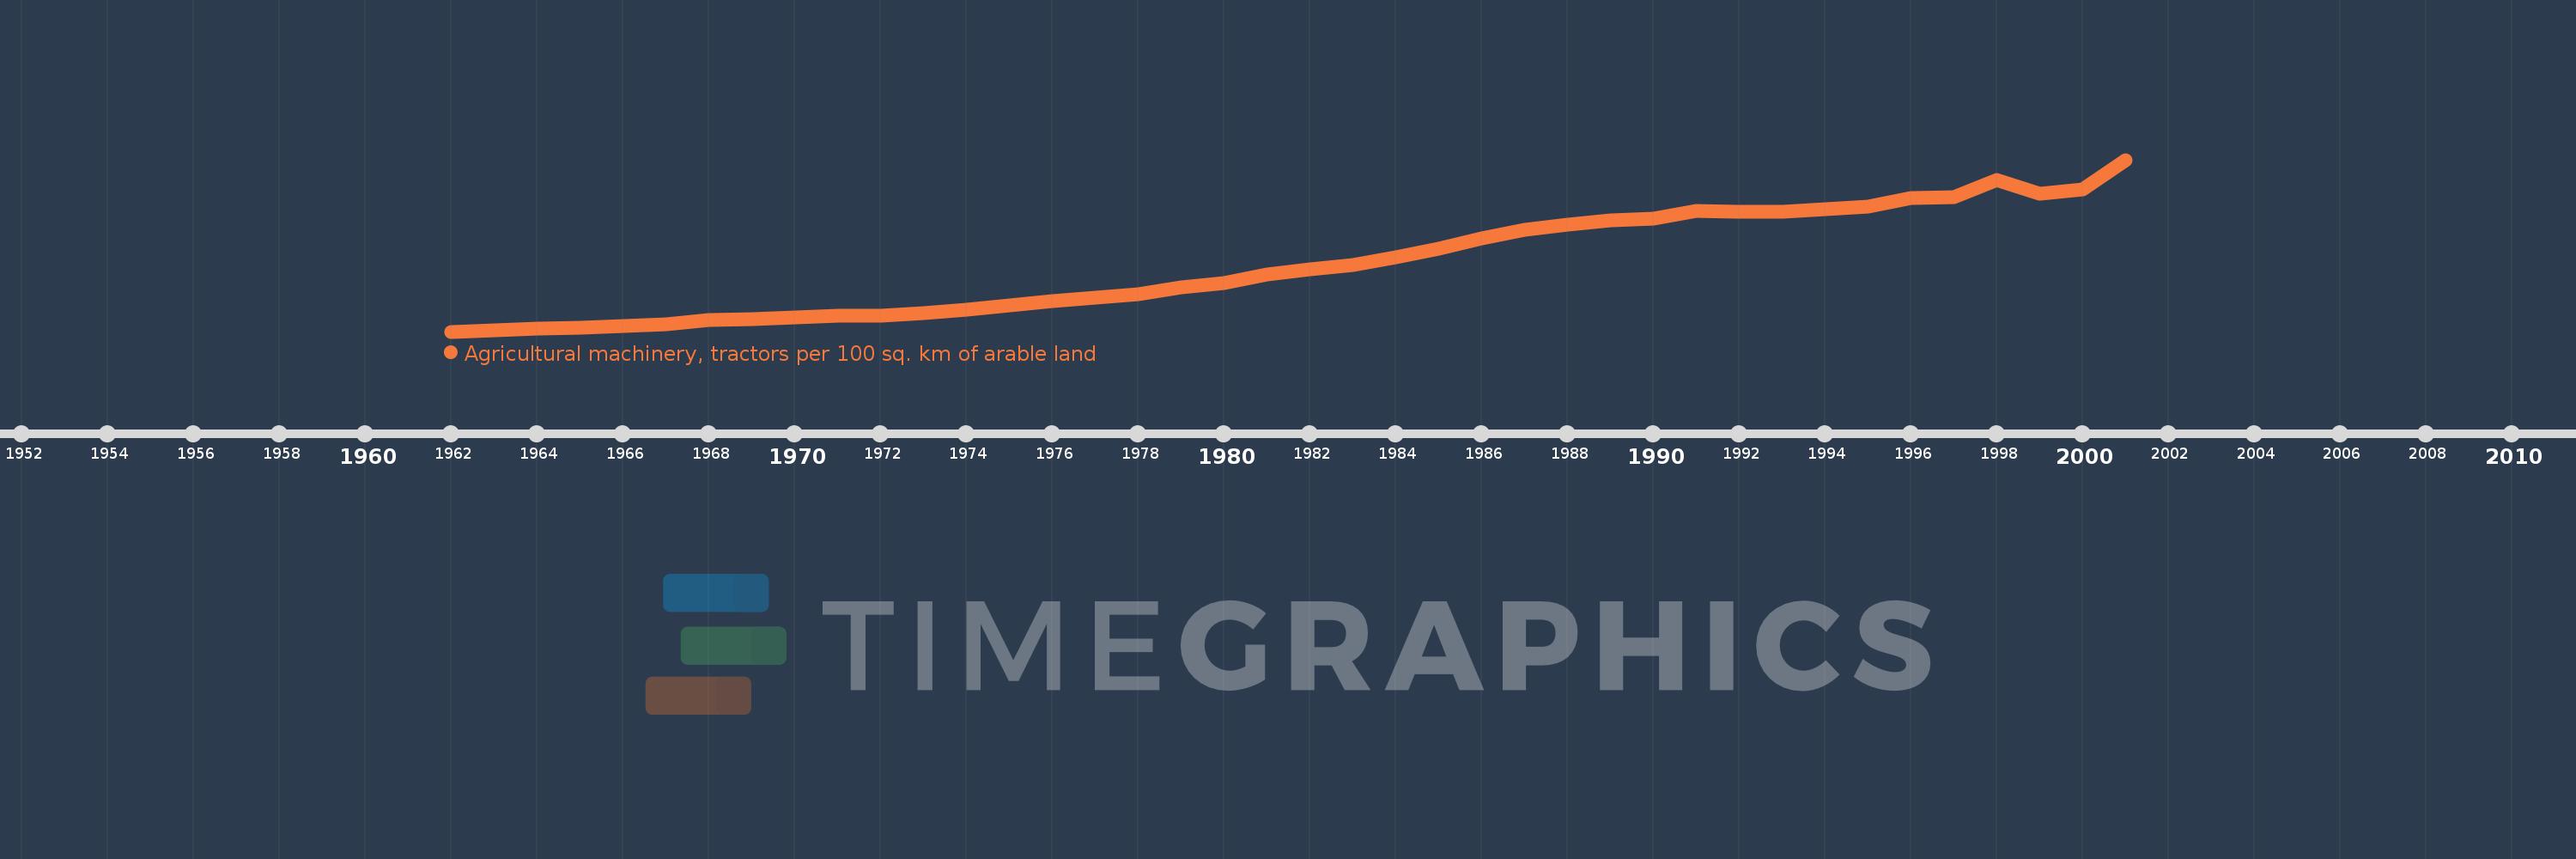
Agricultural machinery, tractors per 100 sq. km of arable land
2001,2000,1999,1998,1997,1996,1995,1994,1993,1992,1991,1990,1989,1988,1987,1986,1985,1984,1983,1982,1981,1980,1979,1978,1977,1976,1975,1974,1973,1972,1971,1970,1969,1968,1967,1966,1965,1964,1963,1962
This statistics in other country:
AfghanistanAlbaniaAlgeriaAmerican SamoaAndorraAngolaAntigua and BarbudaArab WorldArgentinaArmeniaAustraliaAustriaAzerbaijanBahamas, TheBahrainBangladeshBarbadosBelarusBelgiumBelizeBeninBermudaBhutanBoliviaBosnia and HerzegovinaBotswanaBrazilBritish Virgin IslandsBrunei DarussalamBulgariaBurkina FasoBurundiCabo VerdeCambodiaCameroonCanadaCaribbean small statesCentral African RepublicCentral Europe and the BalticsChadChileChinaColombiaCongo, Dem. Rep.Congo, Rep.Costa RicaCote d'IvoireCroatiaCubaCyprusCzech RepublicDenmarkDjiboutiDominicaDominican RepublicEarly-demographic dividendEast Asia & PacificEast Asia & Pacific (excluding high income)East Asia & Pacific (IDA & IBRD countries)EcuadorEgypt, Arab Rep.El SalvadorEritreaEstoniaEuro areaEurope & Central AsiaEurope & Central Asia (excluding high income)Europe & Central Asia (IDA & IBRD countries)European UnionFijiFinlandFragile and conflict affected situationsFranceFrench PolynesiaGambia, TheGeorgiaGermanyGhanaGreeceGrenadaGuamGuatemalaGuineaGuinea-BissauGuyanaHaitiHeavily indebted poor countries (HIPC)High incomeHondurasHungaryIBRD onlyIcelandIDA & IBRD totalIDA blendIDA onlyIDA totalIndiaIndonesiaIran, Islamic Rep.IraqIrelandIsraelItalyJamaicaJapanJordanKazakhstanKenyaKiribatiKorea, Dem. People’s Rep.Korea, Rep.KuwaitKyrgyz RepublicLao PDRLate-demographic dividendLatin America & Caribbean Latin America & Caribbean (excluding high income)Latin America & the Caribbean (IDA & IBRD countries)LatviaLeast developed countries: UN classificationLebanonLesothoLibyaLiechtensteinLithuaniaLow & middle incomeLow incomeLower middle incomeLuxembourgMacedonia, FYRMadagascarMalawiMalaysiaMaliMaltaMauritaniaMauritiusMexicoMiddle East & North AfricaMiddle East & North Africa (excluding high income)Middle East & North Africa (IDA & IBRD countries)Middle incomeMoldovaMongoliaMoroccoMozambiqueMyanmarNepalNetherlandsNew CaledoniaNew ZealandNicaraguaNigerNigeriaNorth AmericaNorthern Mariana IslandsNorwayOECD membersOmanOther small statesPakistanPanamaPapua New GuineaParaguayPeruPhilippinesPolandPortugalPost-demographic dividendPre-demographic dividendPuerto RicoQatarRomaniaRussian FederationRwandaSamoaSao Tome and PrincipeSaudi ArabiaSenegalSerbiaSeychellesSierra LeoneSlovak RepublicSloveniaSmall statesSolomon IslandsSomaliaSouth AfricaSouth AsiaSouth Asia (IDA & IBRD)SpainSri LankaSt. Kitts and NevisSt. LuciaSt. Vincent and the GrenadinesSub-Saharan Africa Sub-Saharan Africa (excluding high income)Sub-Saharan Africa (IDA & IBRD countries)SudanSurinameSwazilandSwedenSwitzerlandSyrian Arab RepublicTajikistanTanzaniaThailandTimor-LesteTogoTongaTrinidad and TobagoTunisiaTurkeyTurkmenistanUgandaUkraineUnited Arab EmiratesUnited KingdomUnited StatesUpper middle incomeUruguayVanuatuVenezuela, RBVietnamVirgin Islands (U.S.)West Bank and GazaWorldYemen, Rep.ZambiaZimbabwe Timeline:
This timeline shows a graph from 1962 to 2001 of Middle East & North Africa (excluding high income). No data until 1961. Number of actual observations by date: 40.
Source name:
World Development Indicators
Source organization:
Food and Agriculture Organization, electronic files and web site.
Categories, topics:
Agriculture & Rural Development
Last updated:
apr 23, 2017
Indicators value changes by year
Minimum:
16.445
jan 1, 1962
Maximum:
159.262
jan 1, 2001
At the date of observation
Value
Absolute change
Change from previous value
jan 1, 1962
16.445
+16.445
0.0%
jan 1, 1963
17.563
+1.118
6.8%
jan 1, 1964
18.588
+1.024
5.83%
jan 1, 1965
19.835
+1.247
6.71%
jan 1, 1966
21.009
+1.175
5.92%
jan 1, 1967
22.732
+1.723
8.2%
jan 1, 1968
25.838
+3.106
13.66%
jan 1, 1969
26.94
+1.102
4.26%
jan 1, 1970
28.381
+1.441
5.35%
jan 1, 1971
29.558
+1.178
4.15%
jan 1, 1972
29.992
+0.434
1.47%
jan 1, 1973
31.961
+1.969
6.57%
jan 1, 1974
34.846
+2.885
9.03%
jan 1, 1975
38.035
+3.189
9.15%
jan 1, 1976
41.836
+3.801
9.99%
jan 1, 1977
44.765
+2.928
7.0%
jan 1, 1978
47.62
+2.856
6.38%
jan 1, 1979
52.893
+5.273
11.07%
jan 1, 1980
57.071
+4.178
7.9%
jan 1, 1981
63.817
+6.746
11.82%
jan 1, 1982
68.142
+4.325
6.78%
jan 1, 1983
71.959
+3.817
5.6%
jan 1, 1984
78.519
+6.56
9.12%
jan 1, 1985
85.052
+6.533
8.32%
jan 1, 1986
94.101
+9.049
10.64%
jan 1, 1987
100.709
+6.608
7.02%
jan 1, 1988
105.175
+4.466
4.43%
jan 1, 1989
108.696
+3.521
3.35%
jan 1, 1990
110.119
+1.423
1.31%
jan 1, 1991
116.464
+6.345
5.76%
jan 1, 1992
116.222
-0.241
-0.21%
jan 1, 1993
115.916
-0.307
-0.26%
jan 1, 1994
118.363
+2.447
2.11%
jan 1, 1995
120.51
+2.147
1.81%
jan 1, 1996
127.505
+6.995
5.8%
jan 1, 1997
127.926
+0.421
0.33%
jan 1, 1998
142.529
+14.603
11.42%
jan 1, 1999
131.393
-11.136
-7.81%
jan 1, 2000
134.434
+3.041
2.31%
jan 1, 2001
159.262
+24.827
18.47%
Ranking of countries by current statistics by years


Comments: